
Picture this: you’re eyeing a tokenized slice of Apple or SPY ETF, but traditional market hours cramp your style. Chainlink’s latest move flips the script, pumping 24/5 on-chain ETF pricing and stock data straight into DeFi protocols. With LINK trading at $9.61 after a slight dip of -0.7230% over the last 24 hours (high $9.84, low $9.09), this launch couldn’t hit at a more pivotal moment for Chainlink RWA oracles.
Chainlink’s 24/5 U. S. Equities Streams deliver continuous, sub-second updates for major single-name equities and ETFs. We’re talking bid-ask spreads, last trade prices, volumes, market status flags, and even staleness checks, all on-chain five days a week. Pre-market jitters? After-hours swings? Covered. This isn’t just data; it’s the backbone for tokenized stock trading that doesn’t sleep.
Bridging TradFi and DeFi with Precision Pricing
As a swing trader who’s ridden on-chain waves for seven years, I see this as a liquidity lifeline. Before, DeFi platforms starved for real-time U. S. equity feeds during off-hours, forcing stale prices or oracle hacks. Now, protocols like Lighter, BitMEX, and ApeX tap into Chainlink’s streams for perpetuals, synthetics, and tokenized assets. Think accurate pricing for Chainlink tokenized stocks data without the TradFi gatekeepers.
Chainlink’s expansion addresses a critical liquidity gap, enabling accurate pricing for tokenized RWAs across all sessions.
Tokenization of the $80 trillion U. S. equity market just got turbocharged. Developers build perpetual futures mirroring Nasdaq movers or synthetic ETFs that track live, not lag. For us ETF chasers, this means 24/5 exposure without custody headaches or settlement delays. I’ve always preached riding momentum over storms; these streams let you surf precise entries on tokenized SPY or QQQ equivalents.

By integrating Chainlink’s 24/5 Equities Streams as its primary oracle, Lighter is unlocking new low-latency markets that go beyond standard trading hours. https://t.co/1besjKyN8f
24/5, secure pricing supports multi-asset margining, real-time risk management, and reliable index construction across https://t.co/QPoBH3ZtqX
Continuous U.S. equity pricing enables more flexible, globally accessible equity markets compared to traditional exchanges. https://t.co/GgIvfQlczB
Via 24/5 U.S. Equities Streams, HelloTrade users can now access institutional-grade onchain markets. https://t.co/HvXN9w7fPo
Chainlink’s low-latency pricing supports mark prices, funding rates, liquidations, and margin requirements for institutional-ready execution on Aptos. https://t.co/J4a26O5RHa
24/5 pricing enables accurate settlement and greater confidence in resolutions to always-on prediction markets. https://t.co/cdakBIUTQU

Tokenized ETFs Get a Real-Time Upgrade
Dive deeper: these streams pack context-rich metadata. Not just a price tick, but the full picture – volume surges signaling breakouts, bid-ask tightness for volatility plays. For on-chain ETFs, this powers dynamic rebalancing or options-like structures. Imagine a tokenized ARKK that adjusts holdings based on live Tesla bids at 4 a. m.
Check the official word: continuous data across pre-market, regular, and after-hours, fueling advanced products. As RWAs explode – stocks and bonds tipped as 2026 game-changers – Chainlink’s oracles ensure compliance-grade pricing. No more black swan blindsides from outdated feeds.
- Sub-second updates for 100 and major U. S. equities and ETFs
- High-throughput to handle DeFi scale
- Staleness flags to dodge bad data
Platforms integrating now prove the pudding. BitMEX’s perps will price tighter; ApeX gains edge in synthetics. For investors like you, hunting alpha in tokenized assets, this slashes slippage on swings.
Chainlink’s Market Pulse Amid the Launch
LINK holds steady at $9.61, shrugging off that minor 24-hour pullback. In swing terms, it’s coiling near recent lows, with volume hinting at accumulation. This equities push validates Chainlink’s oracle dominance, especially as RWA TVL climbs.
Chainlink (LINK) Price Prediction 2027-2032
Forecasts based on 24/5 U.S. Equities Data Streams launch, RWA tokenization momentum, and broader market trends from 2026 baseline ($9.61 current price)
| Year | Minimum Price | Average Price | Maximum Price | YoY Change % (Avg from 2026 $12.00 baseline) |
|---|---|---|---|---|
| 2027 | $12.50 | $18.50 | $28.00 | +54.2% |
| 2028 | $20.00 | $32.00 | $50.00 | +72.9% |
| 2029 | $28.00 | $45.00 | $75.00 | +40.6% |
| 2030 | $35.00 | $60.00 | $100.00 | +33.3% |
| 2031 | $45.00 | $80.00 | $140.00 | +33.3% |
| 2032 | $55.00 | $105.00 | $190.00 | +31.3% |
Price Prediction Summary
Chainlink’s launch of 24/5 U.S. Equities Data Streams positions it as a leader in RWA tokenization and DeFi pricing, driving strong long-term growth. Average prices are projected to rise from $18.50 in 2027 to $105.00 in 2032 (CAGR ~41%), with maximums reflecting bull market adoption and minimums accounting for corrections. Short-term momentum supports initial upside from current $9.61.
Key Factors Affecting Chainlink Price
- 24/5 U.S. Equities Streams enabling tokenized stocks/ETFs with sub-second on-chain data
- Integrations by Lighter, BitMEX, ApeX boosting DeFi liquidity and product innovation
- RWA tokenization boom, bridging $80T U.S. equity market to blockchain
- Post-2026 crypto bull cycle and Bitcoin halving effects
- Favorable regulatory shifts for tokenized assets and oracles
- Chainlink’s oracle dominance amid limited competition
- Technological advancements in data reliability, throughput, and metadata
- Macro trends: institutional adoption, perpetuals, and synthetic assets
Disclaimer: Cryptocurrency price predictions are speculative and based on current market analysis.
Actual prices may vary significantly due to market volatility, regulatory changes, and other factors.
Always do your own research before making investment decisions.
Why the buzz? It unlocks on-chain access to multitrillion-dollar markets outside NYSE hours. DeFi’s evolution from crypto-only to hybrid TradFi plays hinges on feeds like these. I’ve traded enough tokenized betas to know: reliable 24/5 on-chain ETF pricing turns good setups into profitable rides. Learn more on how these streams transform management at CryptoETFPro.
Platforms like Lighter are already leveraging these streams for tokenized stock trading, offering perps that mirror real-world moves without the usual oracle lag. This isn’t hype; it’s executable alpha for on-chain ETF plays.

Swing Trading Tokenized Assets: My Playbook with Chainlink Feeds
Let’s get tactical. As someone who’s timed swings on tokenized betas for years, these Chainlink RWA oracles sharpen my edge. Spot a pre-market gap-up in NVDA? Chainlink pipes sub-second bids on-chain, letting you enter a synthetic long before NYSE bells. Pair it with volume metadata for conviction – thin bids scream fakeouts, fat ones signal follow-through.
Take SPY equivalents: during after-hours earnings dumps, stale feeds killed momentum chasers. Now, with 24/5 coverage, you ride the full wave. I’ve backtested setups where off-hour pricing shaved 2-3% off entries. At LINK’s current $9.61 perch – down just -0.7230% on the day amid high $9.84 and low $9.09 – this utility narrative bolsters accumulation plays.
| Asset Type | Key Data Fields | Trading Impact |
|---|---|---|
| Single-Name Stocks (e. g. , AAPL) | Bid-ask, last trade, volume | Precise perps and synthetics |
| ETFs (e. g. , QQQ) | Market status, staleness flags | Dynamic rebalancing |
| All Sessions | Pre/regular/after-hours | 24/5 liquidity boost |
For ETF investors dipping into blockchain, this means tokenized funds that behave like live TradFi without T and 1 friction. Compliance? Chainlink’s context-aware feeds include flags for halted trades or low liquidity, keeping DeFi honest.
RWA Tokenization Accelerates: ETFs on the Frontline
Zoom out: RWAs hit escape velocity in 2026, per analysts, with stocks leading the charge. Chainlink’s streams plug the multitrillion-dollar gap, turning DeFi into a 24/5 equity playground. Synthetic ETFs could track baskets with live pricing, no rehypothecation risks. I’ve eyed ARK-like tokenized funds; now they adjust on real after-hours flows, not yesterday’s close.
Developer perks shine too – high-throughput handles DeFi TVL spikes, sub-second latency crushes centralized competitors. Lighter’s rollout shows tokenized US stocks gaining traction, with volumes eyeing six figures soon. For pros blending TradFi and crypto, this is the oracle upgrade we’ve craved.
- Enables perpetuals tied to Nasdaq heavies
- Powers options vaults with bid-ask depth
- Flags data freshness for risk models
Dive into oracle roles for pricing tokenized stocks here. It’s not just tech; it’s the swing trader’s secret to chaining wins across sessions.
LINK’s Momentum Ride Ahead
With $9.61 as the anchor, LINK eyes bounces off that $9.09 low. Launch tailwinds from equities streams could spark volume-led pumps, especially if integrations multiply. RWA hype isn’t fleeting – it’s the bridge to trillions. Watch for breakouts above $9.84; that’s your cue for tokenized ETF longs.
Chainlink Technical Analysis Chart
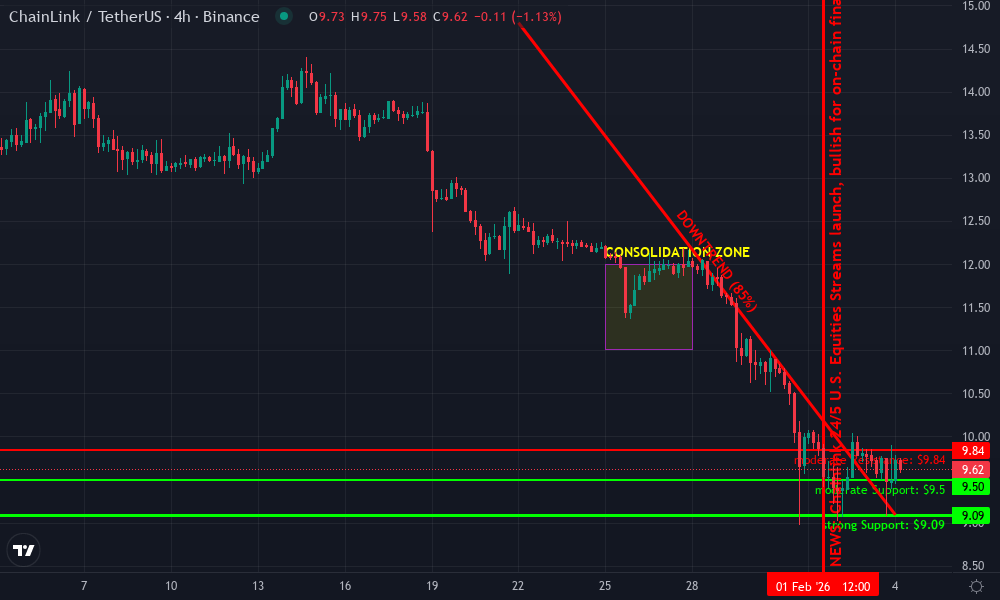
Analysis by Isabella Nguyen | Symbol: BINANCE:LINKUSDT | Interval: 4h | Drawings: 6
Technical Analysis Summary
As Isabella Nguyen, start by drawing a prominent red downtrend line connecting the swing high on 2026-01-22 at $14.80 to the recent low on 2026-02-04 at $9.09, labeling it ‘Primary Bearish Channel’ with 0.85 confidence. Add horizontal support at $9.09 (strong, 24h low) and $9.50 (moderate), resistance at $9.84 (24h high, moderate) and $10.00 (psychological). Use fib retracement from the downswing for potential bounce zones at 23.6% ($10.20). Mark a consolidation rectangle from 2026-01-25 to 2026-01-28 between $11.00-$12.00. Place arrow_mark_up at current $9.61 for potential reversal if volume picks up post-Chainlink news. Add callouts for MACD bearish crossover and declining volume. Vertical line for news event on 2026-02-01. Entry zone long at $9.50 with SL $9.00, PT $10.50. Style lines crisp, red for bearish, green for support/entry.
Risk Assessment: medium
Analysis: Bearish trend intact but oversold at support with strong fundamental catalyst; medium risk aligns with swing tolerance awaiting confirmation
Isabella Nguyen’s Recommendation: Consider long entry at $9.50 SL $9.00 PT $10.50, ride the news wave cautiously
Key Support & Resistance Levels
📈 Support Levels:
-
$9.09 – 24h low and psychological support, strong confluence
strong -
$9.5 – Recent basing zone and minor trend support
moderate
📉 Resistance Levels:
-
$9.84 – 24h high, immediate overhead resistance
moderate -
$10 – Psychological round number, prior consolidation low
weak
Trading Zones (medium risk tolerance)
🎯 Entry Zones:
-
$9.5 – Bounce from strong support amid positive Chainlink news, volume confirmation needed
medium risk
🚪 Exit Zones:
-
$10.5 – Fib 38.2% retracement and prior resistance confluence
💰 profit target -
$9 – Break below strong support invalidates long setup
🛡️ stop loss
Technical Indicators Analysis
📊 Volume Analysis:
Pattern: declining on pullback
Low volume during recent downside suggests weakening sellers, potential base
📈 MACD Analysis:
Signal: bearish crossover with bullish divergence
MACD line below signal but histogram contracting, hinting reversal
Applied TradingView Drawing Utilities
This chart analysis utilizes the following professional drawing tools:
Disclaimer: This technical analysis by Isabella Nguyen is for educational purposes only and should not be considered as financial advice.
Trading involves risk, and you should always do your own research before making investment decisions.
Past performance does not guarantee future results. The analysis reflects the author’s personal methodology and risk tolerance (medium).
These feeds don’t just feed data; they fuel the next era of on-chain finance. Grab exposure via DeFi perps or hold LINK for the oracle surge. In this market, precision pricing turns volatility into velocity. Ride those waves smartly.