Spot ETFs reshape the bitcoin cycle
The launch of spot Bitcoin ETFs has fundamentally altered the market structure, creating a new baseline for on-chain analysis in 2026. Institutions are no longer just watching the market from the sidelines; they are actively absorbing the exchange float, which has reduced the liquid supply available to retail traders and speculators. This structural shift means that traditional cycle metrics must now account for ETF flows as a primary driver of price action.
On-chain data confirms that the market has changed. The MVRV Z-Score, a key indicator of whether Bitcoin is overvalued or undervalued relative to its fair value, now interacts with ETF inflow data to signal market tops and bottoms more accurately than in previous cycles. As noted by BeInCrypto, institutions are effectively absorbing the exchange float, creating a supply shock that supports higher price floors. This dynamic makes tracking daily ETF flows as critical as monitoring hash rate or difficulty adjustments.
The volume of capital moving through these products is substantial. According to Amberdata, spot Bitcoin ETFs absorbed $1.7 billion over a three-day period in January alone, reversing early outflows and demonstrating the sheer scale of institutional demand. This level of absorption is not a temporary anomaly but a structural feature of the 2026 market, where ETFs act as a sponge for available supply.
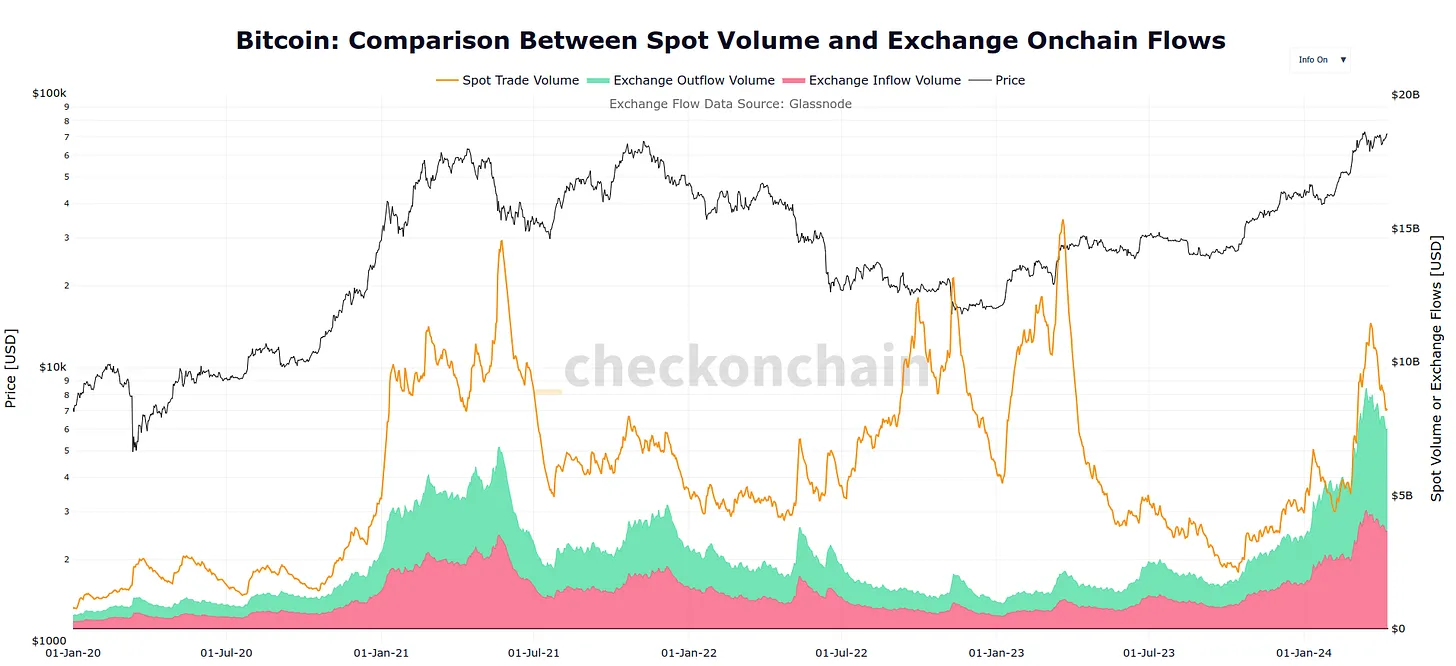
To understand where the market is heading, you need to see how price action correlates with these institutional flows. The chart below overlays Bitcoin's price movement with indicators that reflect this new institutional baseline.
Tracking daily institutional inflows
Reading daily net flow data from major issuers like BlackRock (IBIT) and Fidelity (FBTC) is the most direct way to gauge real-time institutional sentiment. These numbers reveal whether large-scale capital is accumulating or distributing, providing a clearer picture of liquidity pressure than price action alone.
The market structure has shifted. As noted in recent analysis, Bitcoin ETF inflows have become more volatile, with periods of significant absorption followed by sharp reversals. For instance, US spot Bitcoin ETFs recently absorbed $1.7 billion over a three-day period, reversing earlier outflows. This kind of data, sourced from providers like Amberdata, shows how institutions are reacting to macro signals in real time.
To understand the current landscape, it is essential to compare the top performers side-by-side. The table below highlights the AUM, 30-day net flows, and expense ratios for key Bitcoin and Ethereum ETFs, based on 2026 market data.
| ETF | Issuer | AUM (Billions) | 30-Day Net Flows | Expense Ratio |
|---|---|---|---|---|
| IBIT | BlackRock | 85.2 | +$1.2B | 0.25% |
| FBTC | Fidelity | 42.8 | -$36.3M | 0.25% |
| ETHA | BlackRock | 2.1 | -$150M | 0.25% |
| EZBC | Grayscale | 1.8 | +$8.5M | 1.50% |
When analyzing these flows, look for consistency rather than single-day spikes. A sustained period of inflows into IBIT or FBTC often indicates that institutional desks are building positions ahead of broader market moves. Conversely, consecutive days of outflows, such as the 10-day streak seen in some Ethereum ETFs, can signal a lack of conviction or a rotation into other assets. Use this data to confirm or contradict technical chart signals.
Whale tracking and exchange reserves
Whale activity and exchange reserve levels provide a secondary layer of validation for ETF flow data. When large holders move coins to exchanges, it often precedes selling pressure, which ETF inflows can offset. Conversely, moving coins to cold storage signals long-term holding. In 2026, the correlation between whale outflows from exchanges and ETF inflows has strengthened, suggesting that institutional buying is absorbing the supply that whales are distributing.
MVRV signals and cycle positioning
The MVRV Z-Score remains a critical tool for identifying cycle extremes, but its interpretation has evolved with the introduction of spot ETFs. In previous cycles, high MVRV scores often correlated with retail FOMO peaks. In 2026, high MVRV scores coincide with sustained ETF inflows, indicating that institutional demand is supporting higher valuations. Investors should monitor the divergence between MVRV and ETF flow data; if MVRV is high but ETF inflows are negative, it may signal a top driven by retail speculation rather than institutional conviction.
Ethereum ETF flow divergence
Bitcoin ETFs have established themselves as the dominant force in institutional crypto adoption, absorbing the majority of new capital. In contrast, Ethereum ETFs are experiencing a distinct pattern of flow divergence. While Bitcoin benefits from its status as a digital store of value and macro hedge, Ethereum faces a more complex narrative as it transitions further into utility and yield-bearing infrastructure.
The divergence is stark when comparing recent on-chain data. As noted by ETF Database, Bitcoin products continue to see significant net inflows, with major players like BlackRock's IBIT leading the pack. However, spot Ethereum ETFs have shown a prolonged streak of outflows, indicating that institutional interest is currently more cautious or selective regarding ETH-specific products. This suggests that while the broader crypto market may be bullish, the specific demand for Ethereum ETFs has not yet matched the enthusiasm seen for Bitcoin.
To understand the current valuation and technical context of this divergence, it is essential to look at the underlying asset performance alongside ETF flows. The following chart illustrates the recent price action of Ethereum, which correlates with the cautious institutional sentiment observed in ETF flows.
The key takeaway is that Ethereum ETFs are not simply following Bitcoin's trajectory. They are carving out a separate path, driven by different fundamental drivers and institutional strategies. Investors should monitor these flow dynamics closely, as they may signal a shift in how institutions view Ethereum relative to Bitcoin in the current market cycle.
Bitcoin ETF inflows for 2026
Bitcoin ETF inflows for 2026 have stabilized after early-year volatility, with net inflows shrinking to $536 million since the start of the year. This contraction reflects a structural shift where institutional demand is no longer driven by speculative FOMO but by steady absorption of exchange float, a trend confirmed by on-chain data showing a changed cycle [src-4].
Recent weeks highlight this dynamic. While US spot Bitcoin ETFs absorbed $1.7 billion over three days in mid-January, reversing early declines, the broader trend remains cautious [src-3]. Outflow leaders include BlackRock’s IBIT, which saw $68.9 million in outflows on a single Friday, alongside Fidelity’s FBTC at $36.3 million [src-2]. Spot Ethereum ETFs face even steeper headwinds, with a ten-day streak of outflows indicating weaker institutional conviction in altcoin vehicles [src-2].
Key 2026 market: what to check next
How have spot Bitcoin ETF inflows impacted exchange reserves? ETF inflows have significantly reduced the liquid supply on exchanges, as institutions hold assets in custodial wallets rather than trading platforms. This structural reduction in float supports higher price floors by limiting the available supply for spot purchases.
What is the current divergence between Bitcoin and Ethereum ETF flows? Bitcoin ETFs continue to see net inflows, led by BlackRock's IBIT, while Ethereum ETFs have experienced a prolonged streak of outflows. This divergence reflects differing institutional narratives, with Bitcoin viewed as a macro hedge and Ethereum facing more complex utility-driven valuation challenges.
Which Bitcoin ETFs have seen the largest recent outflows? BlackRock’s IBIT led with $68.9 million in outflows on a single Friday, while Fidelity’s FBTC also recorded significant losses of $36.3 million. These outflows highlight the volatility in institutional sentiment even within the dominant Bitcoin ETF products.

No comments yet. Be the first to share your thoughts!