Spot Bitcoin ETF holdings surge in 2026
Institutional capital has fundamentally reshaped the spot Bitcoin ETF landscape this year. Total on-chain holdings across US-listed spot Bitcoin ETFs have expanded significantly, marking a decisive shift from the retail-heavy inflows of the initial launch period to sustained institutional accumulation. This growth trajectory reflects a maturing market where large-scale asset allocators are treating Bitcoin exposure as a standard portfolio component rather than a speculative experiment.
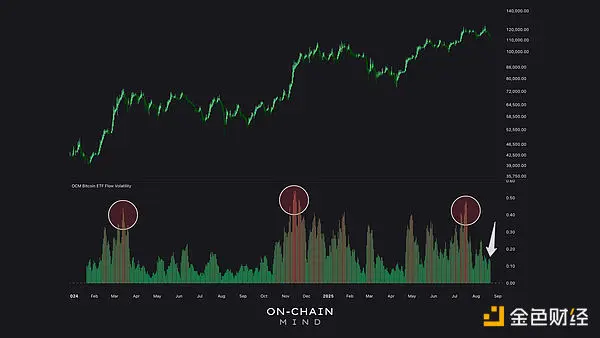
The cumulative assets under management now dwarf previous records, driven largely by continuous daily net inflows from major providers like BlackRock and Fidelity. Unlike the volatile, event-driven spikes seen in 2024, 2026 flows have been characterized by steady, directional growth, suggesting that underlying demand is structural rather than transient. This stability has allowed ETFs to absorb market volatility more effectively, reducing the premium-discount swings that plagued early trading sessions.
This surge in holdings correlates with broader macroeconomic trends, including increased corporate treasury adoption and the integration of crypto assets into traditional retirement accounts. As regulatory clarity improves and custodial infrastructure matures, the barrier to entry for institutional players continues to lower. The result is a market where ETF holdings serve as a reliable barometer for long-term Bitcoin sentiment, offering a clearer view of institutional conviction than secondary market price action alone.
Daily inflows reveal steady institutional accumulation
Tracking daily net inflows into spot Bitcoin ETFs provides a clearer picture of market momentum than price action alone. While spot prices fluctuate with short-term sentiment, consistent net inflows indicate sustained buying pressure from institutional investors who are accumulating assets rather than trading them for quick profits. This distinction is critical for understanding the underlying strength of the current market cycle.
The largest providers, BlackRock (IBIT) and Fidelity (FBTC), dominate these flows. Their ability to attract billions in net new assets demonstrates a shift from speculative trading to long-term portfolio allocation. When these giants see steady daily additions, it suggests that traditional finance firms are treating Bitcoin as a core reserve asset, similar to gold, rather than a volatile speculative instrument.
To compare the scale of this accumulation, we look at the top five spot Bitcoin ETFs by Assets Under Management (AUM). This table highlights the disparity in scale between the market leaders and smaller competitors, illustrating where the bulk of institutional capital is currently flowing.
| Ticker | Provider | AUM (Approx) | Avg Daily Vol |
|---|---|---|---|
| IBIT | BlackRock | $85B+ | $2.5B+ |
| FBTC | Fidelity | $35B+ | $1.2B+ |
| GBTC | Grayscale | $25B+ | $500M+ |
| BTCO | Ark/21Shares | $3B+ | $100M+ |
| BITB | Bitwise | $2B+ | $50M+ |
The data above, sourced from The Block, shows that IBIT and FBTC handle the vast majority of daily volume. This concentration of liquidity reduces friction for large institutional trades, making these ETFs the primary conduit for traditional capital entering the crypto space. Smaller ETFs often see more volatile flows, reflecting retail or smaller fund activity rather than steady institutional accumulation.
Understanding these flows helps distinguish between passive accumulation and speculative trading. Passive accumulation is characterized by consistent, often smaller, daily inflows that add up over time. Speculative trading, by contrast, appears as large, erratic spikes in volume followed by rapid outflows. The current trend in IBIT and FBTC suggests the former is dominant, providing a stable foundation for price appreciation.
Whale Alerts Signal Large Block Trades
On-chain whale alerts for crypto ETFs provide a distinct signal from retail market activity. Unlike spot Bitcoin transactions, which move directly on the blockchain, ETF share movements often occur through over-the-counter (OTC) desks or large block trades. These transactions allow institutional investors to accumulate or distribute significant positions without immediately impacting the public order book.
Tracking these alerts helps differentiate between short-term retail sentiment and long-term institutional positioning. When large blocks of ETF shares are transferred to cold storage or custodial wallets, it often indicates accumulation by major financial entities. Conversely, large outflows to trading desks may signal preparation for liquidation or hedging strategies.
This data is particularly useful for tracking the flow of capital into major spot Bitcoin ETFs, such as BlackRock’s IBIT or Fidelity’s FBTC. Monitoring these specific flows offers a clearer view of institutional demand than price action alone, as large players can absorb volatility without triggering immediate market reactions.
To visualize the broader market context, we can look at the price action of the underlying asset. Understanding the correlation between whale activity and price trends helps in assessing the strength of institutional conviction.
Volume Analysis and Liquidity Depth
Trading volume relative to Assets Under Management (AUM) serves as the primary indicator of market health for spot crypto ETFs. When high trading volumes coincide with stable prices, it signals deep liquidity and efficient price discovery. Conversely, low volume paired with high volatility often points to market fragility, where thin order books allow large trades to cause disproportionate price swings.
To assess this dynamic, we track real-time trading activity for the largest spot Bitcoin ETFs. The following widgets provide live price data for BlackRock’s IBIT and Fidelity’s FBTC, the two most liquid vehicles in the sector. Monitoring their spreads and volume helps gauge institutional participation levels.
For a deeper look at price action and volume trends, the chart below visualizes daily performance. This data helps identify whether volume spikes are driven by institutional rebalancing or speculative retail flows. Consistent volume without extreme price deviation suggests a mature, stable market structure.
Blockchain ETFs vs spot Bitcoin ETFs
Investors often confuse two distinct asset classes: spot Bitcoin ETFs and broader blockchain ETFs. Spot Bitcoin ETFs, such as BlackRock’s IBIT or Fidelity’s FBTC, hold actual Bitcoin. Their performance tracks the price of the coin directly. When Bitcoin moves, these funds move with it.
Blockchain ETFs operate differently. They hold equities in companies involved in blockchain technology. This includes mining firms, exchanges like Coinbase, and software developers. The iShares Blockchain and Tech ETF (IBLC) is a primary example. These funds track the stock market performance of tech companies, not the cryptocurrency itself.
The distinction matters for portfolio construction. Spot Bitcoin ETFs offer pure crypto exposure. Blockchain ETFs provide diversified equity exposure to the sector. A blockchain company’s stock price may rise even if Bitcoin’s price falls, depending on the company’s broader business performance.
Above, Bitcoin’s price action is compared against Coinbase (COIN), a major component of many blockchain ETFs. The correlation is strong but not perfect. Equity markets add layers of complexity, including regulatory risks and company-specific earnings.
| Asset Class | Underlying Asset | Primary Risk |
|---|---|---|
| Spot Bitcoin ETF | Bitcoin (BTC) | Crypto market volatility |
| Blockchain ETF | Tech Equities | Stock market & company performance |
Spot Bitcoin ETFs are simpler instruments. They remove the hassle of digital wallets but keep the volatility of the asset. Blockchain ETFs act like traditional tech sector funds. They offer a way to bet on the adoption of blockchain technology without holding the currency.
When tracking institutional flows, check the fund’s prospectus. Spot ETFs report on-chain holdings. Blockchain ETFs report equity holdings. Confusing the two leads to incorrect risk assessments. Always verify what the fund actually owns before investing.
Key Questions on Crypto ETF On-Chain Data
Investors tracking institutional flows often confuse general blockchain exposure with specific on-chain economic activity. Understanding the distinction helps in selecting the right vehicle for your analysis.

No comments yet. Be the first to share your thoughts!