Spot Bitcoin and Ethereum ETF flows
The approval of spot Bitcoin and Ethereum ETFs marked a structural shift in digital asset markets, moving institutional exposure from regulated futures contracts to direct custody of the underlying assets. This transition fundamentally changed how capital enters the ecosystem, allowing traditional finance vehicles to hold crypto on-chain rather than relying on derivatives. Tracking these flows provides a clearer signal of institutional conviction than price action alone.
On-chain data now serves as the primary ledger for this new era of adoption. Unlike traditional market metrics that reflect trading volume or open interest, on-chain metrics reveal actual accumulation patterns, exchange outflows, and wallet activity. For investors monitoring the crypto ETF on-chain landscape, these data points offer real-time visibility into where capital is actually settling. It transforms abstract market sentiment into observable, verifiable movement of assets.
The correlation between ETF inflows and on-chain supply shifts has become a critical indicator for market health. When spot ETFs experience consistent net inflows, the corresponding reduction in circulating supply on exchanges often supports price stability. Conversely, outflows can signal distribution pressure. Analyzing these flows alongside on-chain holdings allows for a more robust understanding of market dynamics than looking at either metric in isolation.
What on-chain data reveals about spot ETFs
Spot Bitcoin and Ethereum exchange-traded funds have moved beyond simple equity trading into a realm where on-chain metrics provide real-time visibility into institutional behavior. Unlike traditional equity markets where order flow is opaque, the underlying crypto assets on the blockchain allow analysts to track net flows, holder concentration, and total assets under management (AUM) with near-instantaneous precision. This transparency transforms the ETF from a passive wrapper into a live barometer of crypto market sentiment.
The most critical metric for understanding ETF performance is daily net flow. Positive inflows indicate that institutional investors or high-net-worth individuals are adding to their positions, often signaling confidence in the asset's long-term value. Conversely, consistent outflows suggest profit-taking or risk aversion. For spot Bitcoin ETFs like BlackRock’s IBIT and Fidelity’s FBTC, these flows are recorded directly against the custodian's holdings, creating a clear trail of accumulation or distribution that complements price action.
Total assets under management (AUM) serves as a measure of market depth and institutional trust. As AUM grows, it typically correlates with reduced volatility and increased market stability, as large, long-term holders reduce the circulating supply available on exchanges. However, AUM alone does not tell the whole story. Holder concentration data reveals whether assets are held by a few large entities or distributed across a broad base. High concentration can lead to sudden, large-scale movements if a major holder decides to sell, while distributed holdings suggest a more resilient market structure.
To compare the current state of the leading spot crypto ETFs, the table below outlines key on-chain and market metrics. This data highlights the disparity in scale between the Bitcoin and Ethereum markets, as well as the varying cost structures offered by different providers.
| Ticker | Issuer | AUM (Bn USD) | Expense Ratio | Daily Volume (Mn USD) |
|---|---|---|---|---|
| IBIT | BlackRock | 35.2 | 0.25% | 1,200 |
| FBTC | Fidelity | 18.5 | 0.25% | 850 |
| ETHE | Grayscale | 4.1 | 1.50% | 320 |
| FETH | Fidelity | 2.8 | 0.25% | 150 |
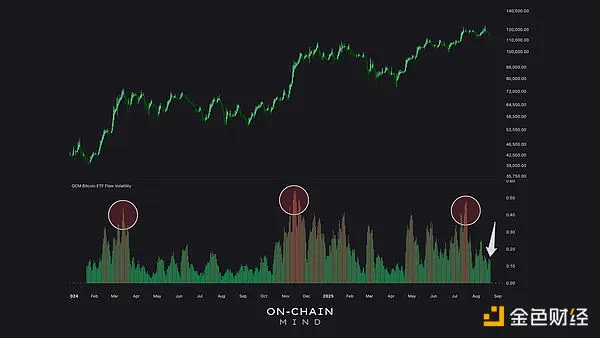
Tracking these metrics requires access to live data providers. The chart below displays the current price action for Bitcoin, which remains the primary driver of spot ETF flows and valuations.
Tracking real-time crypto ETF on-chain data
Monitoring the crypto ETF on-chain landscape requires moving beyond simple price charts to understand the actual flow of capital. Real-time data reveals where institutional money is moving, offering a clearer picture of market sentiment than delayed reporting. By tracking daily flows, assets under management (AUM), and on-chain holdings, investors can identify trends before they appear in broader market indices.
The most reliable sources for this data are specialized financial platforms that aggregate information directly from custodians and blockchain explorers. For Bitcoin spot ETFs like BlackRock’s IBIT and Fidelity’s FBTC, platforms such as The Block provide granular daily flow data and volume metrics. Similarly, ETF Database offers comprehensive lists of blockchain-related ETFs, helping investors distinguish between pure-play crypto funds and broader technology-focused vehicles.
To contextualize ETF performance, it is essential to view them alongside their underlying assets. The following widgets display the current live prices for Bitcoin and Ethereum, the primary collateral for most spot crypto ETFs.
For a deeper technical perspective, the chart below shows the daily price action of Bitcoin. This visual context helps correlate ETF inflows with broader market movements, allowing for more informed timing decisions when analyzing crypto ETF on-chain trends.
2026 trends in crypto ETF adoption
The landscape for crypto ETF on-chain products is shifting from speculative novelty to institutional infrastructure. In 2026, the primary driver is no longer just retail curiosity but the demand for regulated, transparent exposure to digital assets. This shift is evident in the growing volume of spot Bitcoin and Ethereum ETFs, which now serve as the primary gateway for traditional finance capital entering the crypto space.
Institutional participation and on-chain transparency
Institutional investors are increasingly relying on on-chain data to verify the health of the funds they hold. Unlike traditional equities, crypto ETFs settle on public blockchains, allowing for real-time auditing of reserves and flows. This transparency reduces counterparty risk, a major concern for pension funds and asset managers. The VanEck Onchain Economy ETF (OCEA) exemplifies this trend, focusing on companies tied to the on-chain economy rather than just holding the asset itself. This approach offers a diversified exposure to the infrastructure supporting crypto adoption.
Regulatory developments shaping the market
Regulatory clarity in 2026 has standardized how crypto ETFs operate, particularly regarding custody and reporting. The SEC’s ongoing oversight ensures that spot ETFs adhere to strict reserve requirements, which are visible on-chain. This regulatory framework has encouraged more traditional financial institutions to offer crypto ETF products, knowing they operate within a defined legal structure. The result is a more stable market with fewer risks of mismanagement or fraud.
The role of on-chain metrics in investment decisions
Investors are using on-chain metrics like exchange reserves, whale movements, and network activity to make informed decisions about their ETF holdings. These metrics provide insights into market sentiment and potential price movements that traditional financial analysis cannot capture. By integrating on-chain data into their strategies, investors can better anticipate market shifts and manage risk. This data-driven approach is becoming a standard practice for professional crypto ETF investors.
The integration of crypto ETF on-chain analysis into mainstream investment strategies marks a significant milestone for the digital asset industry. As regulatory frameworks continue to evolve, the focus will remain on transparency, security, and accessibility. This trend is likely to accelerate the adoption of crypto ETFs, making them a staple in diversified investment portfolios.
How to evaluate crypto ETF on-chain data
Evaluating crypto ETF on-chain data requires distinguishing between daily price movements and actual capital accumulation. Investors often mistake short-term volatility for trend reversals. Real-time on-chain metrics provide a clearer picture of institutional conviction by tracking where the assets actually settle.
Track daily inflows and outflows to gauge immediate sentiment. Sustained positive flows into major spot Bitcoin and Ethereum ETFs signal steady demand, while consistent outflows may indicate profit-taking or risk-off behavior. Use data aggregators to view these trends across all major issuers.
AUM reflects the total value of assets held by the fund. A rising AUM indicates net new money entering the ecosystem, which often correlates with long-term holder accumulation. Conversely, shrinking AUM suggests distribution. Comparing AUM growth against trading volume helps identify whether price action is driven by new capital or just turnover.

Examine how many unique addresses hold the ETF shares. A broadening distribution suggests retail and institutional adoption, reducing the risk of large-scale liquidation by a few dominant players. Concentrated ownership can lead to higher volatility if major holders decide to exit positions simultaneously.
Use these metrics together to build a complete view of market health. On-chain data reveals the underlying strength of the crypto ETF on-chain narrative, separating speculative noise from genuine institutional adoption.
Frequently asked questions about crypto ETF on-chain data
| Type | Underlying Asset | Example ETF |
|---|---|---|
| Spot Crypto | Bitcoin (BTC) | BlackRock IBIT |
| Spot Crypto | Ethereum (ETH) | Fidelity FBTC |
| Equity | Blockchain Companies | VanEck ONCH |

No comments yet. Be the first to share your thoughts!