How to read crypto ETF on-chain data
The most reliable way to track institutional flows for 2026 crypto ETFs is through real-time Net Asset Value (NAV) premiums and authorized participant (AP) creation/redemption filings. Unlike spot crypto prices, which move every second, ETF premiums reveal the actual demand premium institutions are willing to pay for regulated exposure.
You can monitor these flows directly on official provider dashboards. BlackRock’s IBIT and Fidelity’s FETH show daily creation unit activity, while Grayscale’s GDLC offers a multi-asset view. For a broader market pulse, CoinMarketCap’s ETF dashboard aggregates net flow charts, allowing you to see which funds are absorbing capital versus seeing outflows.
When analyzing NAV premiums, look for sustained premiums above 0.5% during market dips. This signals strong institutional buying pressure that isn't reflected in the underlying asset's spot price. Conversely, consistent discounts indicate institutional distribution or hedging activity. Tracking these metrics provides a clearer picture of institutional conviction than simple price action alone.
| Data Source | Primary Metric | Update Frequency |
|---|---|---|
| BlackRock/Fidelity | AP Creation/Redemption | Daily |
| CoinMarketCap | Net Flow Charts | Real-time |
| Provider Websites | NAV Premium/Discount | Daily |
Crypto etf on-chain data choices that change the plan
Tracking institutional flows requires balancing the immediacy of on-chain signals against the lag of traditional settlement data. When evaluating crypto ETFs for 2026, you are essentially comparing two different clocks: the blockchain’s real-time ledger and the fund’s daily Net Asset Value (NAV) calculation.
On-chain data for spot ETFs like BlackRock’s IBIT or Fidelity’s FETH provides a near-instant view of creation and redemption activity. This allows you to spot institutional accumulation or distribution hours before the market closes. However, this visibility comes with noise. Large wallet movements can be internal fund rebalancing rather than new capital inflows, leading to false signals if you do not filter for authorized participant (AP) activity.
Conversely, official NAV reports offer precision but lack speed. They confirm the exact value of holdings only after market close. For traders trying to capture intraday volatility, relying solely on NAV data means reacting to yesterday’s news. The tradeoff is clear: on-chain data offers speed and granularity but requires careful interpretation, while NAV data offers accuracy but sacrifices timeliness.
To make an informed decision, compare the following factors side-by-side based on your trading horizon and risk tolerance.
| Factor | On-Chain Data | Official NAV |
|---|---|---|
| Timeliness | Real-time (seconds/minutes) | Daily (post-market close) |
| Data Granularity | High (individual transactions) | Low (aggregate fund value) |
| Accuracy | Medium (requires AP filtering) | High (audited holdings) |
| Best For | Intraday swing trading | Long-term allocation review |
The choice depends on your strategy. If you are trading short-term momentum, on-chain creation unit flows are your primary indicator. If you are verifying long-term institutional conviction, the daily NAV report is the definitive source. Use both to confirm trends rather than relying on a single data point.
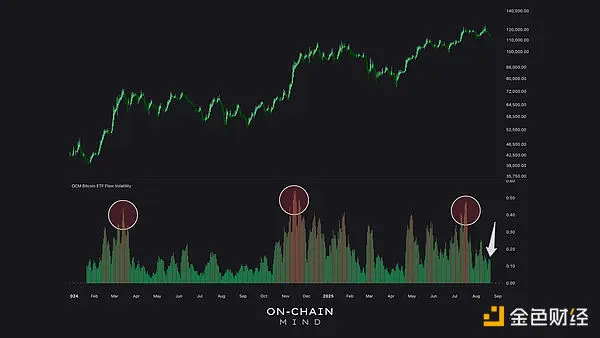
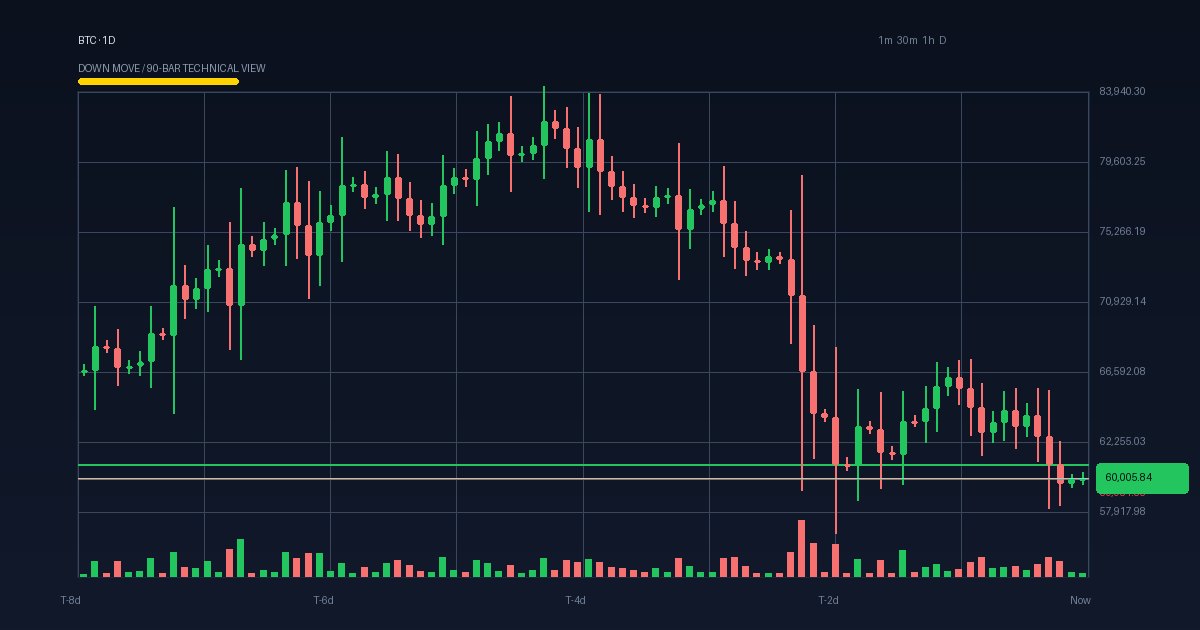
For a visual representation of the underlying asset’s price action that drives these ETF flows, see the technical chart below. This context helps distinguish between price-driven inflows and speculative trading volume.
Choose the next step
Crypto ETF On-Chain Analysis works best as a clear sequence: define the constraint, compare the realistic options, test the tradeoff, and choose the path with the fewest hidden costs. That order keeps the advice usable instead of decorative. After each step, pause long enough to check whether the recommendation still fits the reader's actual situation. If it depends on perfect timing, unusual access, or a best-case budget, include a simpler fallback.
Watch for Misleading ETF Claims and Weak Options
Many 2026 crypto ETF narratives rely on vague promises rather than on-chain evidence. While BlackRock’s IBIT and Morgan Stanley’s MSBT dominate Bitcoin volume, and BlackRock’s ETHA pairs with Fidelity’s FETH for Ethereum, these leaders often mask underlying liquidity traps. Grayscale’s GDLC offers diversified multi-asset exposure, but its structure can dilute pure crypto gains during volatile markets.
Investors frequently mistake high trading volume for strong institutional conviction. This is a critical error. High volume can signal retail speculation or market-maker hedging, not necessarily long-term holding. Always cross-reference ETF net flows with on-chain wallet activity to distinguish between genuine accumulation and short-term trading noise.
Another common mistake is ignoring the NAV premium. A premium indicates strong demand, but it can also signal overvaluation. Conversely, a discount might present a buying opportunity or reveal structural issues with the ETF’s custody or management. Use real-time data to track these premiums, as they fluctuate rapidly based on market sentiment and regulatory news.
To navigate these pitfalls, focus on concrete metrics rather than hype. Monitor the ARK 21Shares Active On-Chain Bitcoin Strategy ETF for insights into active management performance, and use tools like the PriceWidget for BTC to gauge immediate market reactions. This approach helps you separate signal from noise in the crowded 2026 ETF landscape.
Crypto etf on-chain data 2026: what to check next
On-chain tracking has shifted from speculative curiosity to a primary tool for validating institutional demand in 2026. As spot crypto ETFs mature, investors use real-time NAV premiums and flow data to gauge market sentiment before price action reflects it.
Helpful gear
Use these product recommendations as a starting point, then choose the size, material, and price point that fit how you actually use the gear.
![The Crypto Millionaire Bible: [5 in 1] How to Easily Make Life-Changing Money in The Next Big 2025-2026 Bull Run with Smart Investing and Trading Any Cryptocurrency (Altcoins, Meme, NFT, Airdrops)](https://m.media-amazon.com/images/I/61K1jz+cWtL._AC_UY654_QL65_.jpg)


As an Amazon Associate, we may earn from qualifying purchases.

No comments yet. Be the first to share your thoughts!