
Crypto etf on-chain data limits to account for
Tracking real-time institutional flows for crypto ETFs requires looking past the public price charts. While spot Bitcoin and Ethereum ETFs report daily net inflows to the SEC, these figures are lagging indicators. They confirm what happened yesterday, not what is happening now. For traders and analysts, the real-time signal lies in on-chain data, but this data comes with significant constraints.
The primary limitation is granularity. On-chain data shows movements between wallet addresses, but it does not always distinguish between a retail investor rebalancing a personal portfolio and an institutional fund manager executing a large block trade. For example, the recent accumulation in spot Solana ETFs, which has reached nearly $880 million, appears as a series of large transfers into custodial wallets. Without knowing the specific wallet labels, it is difficult to isolate pure institutional demand from other market participants. This ambiguity makes it hard to gauge the true strength of institutional conviction in altcoin-linked products.
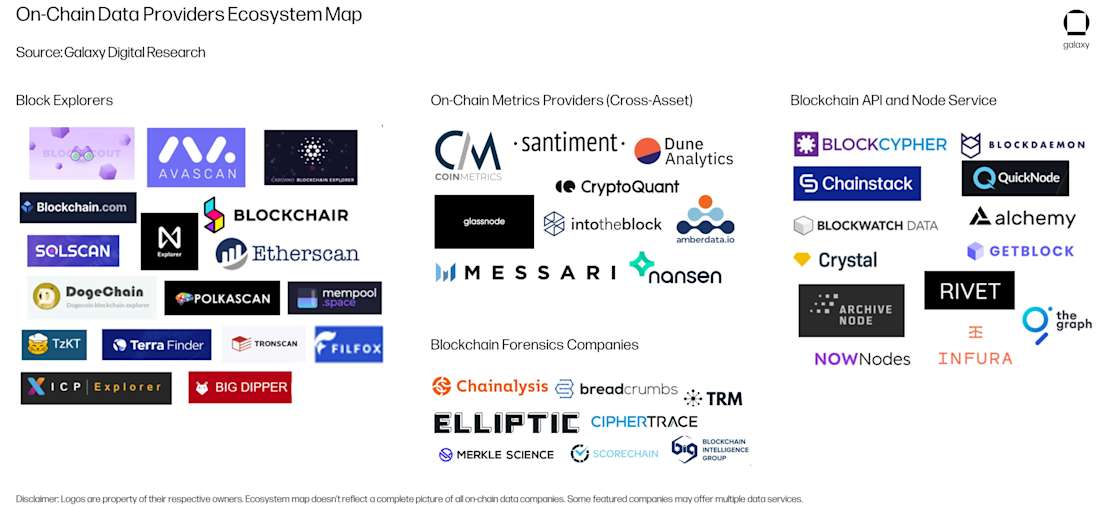
Also, the fragmentation of data sources creates visibility gaps. Bitcoin ETF flows are consolidated and easier to track, but as the market expands into other assets, the data becomes siloed. Some funds report on-chain activity through third-party analytics firms, while others rely on internal custodial records that are not publicly accessible in real time. This lack of a unified on-chain ledger for all crypto ETFs means analysts must piece together fragments of information from multiple providers.
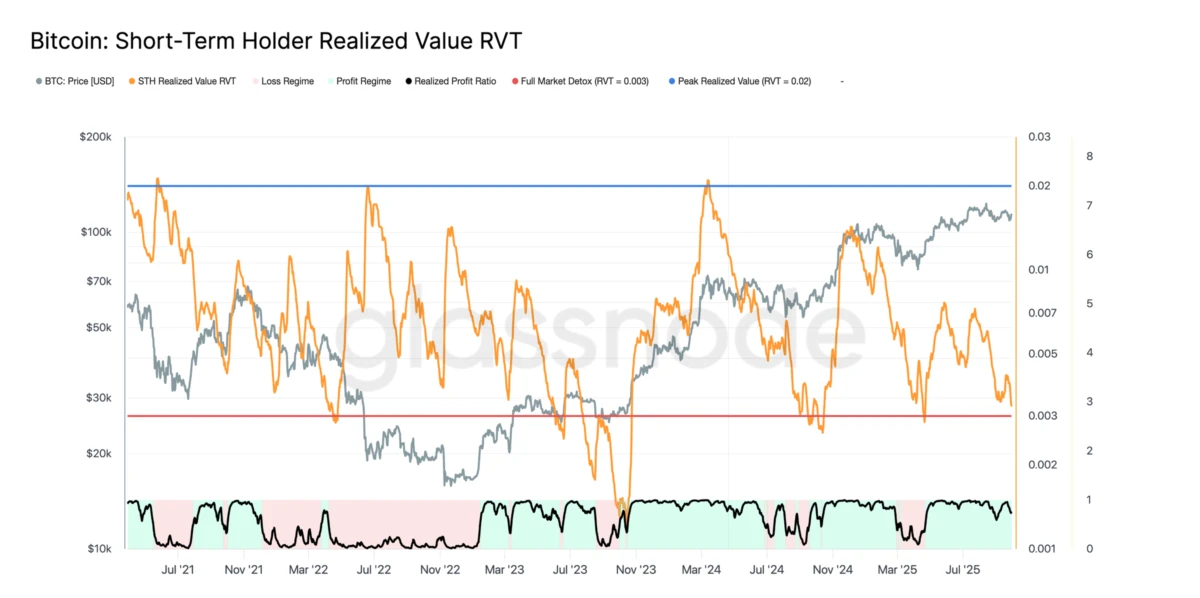
Despite these constraints, on-chain metrics remain essential for understanding market health. By monitoring the movement of coins into and out of exchange wallets, investors can identify accumulation phases before they appear in daily flow reports. The stabilization of demand for spot Bitcoin ETFs, despite earlier price drops, was first visible on-chain as coins moved from exchanges to cold storage. This pattern suggests that holders are positioning for the long term, even if daily net flows show volatility. Understanding these on-chain signals helps investors plan around the complexities of the 2026 crypto ETF landscape.
Crypto etf on-chain data choices that change the plan
Evaluating crypto ETFs requires looking beyond simple price charts. On-chain data provides a window into institutional behavior that traditional volume metrics often miss. By tracking wallet activity, flow patterns, and custody movements, you can distinguish between genuine accumulation and short-term speculation. This section breaks down the concrete factors to evaluate when analyzing these funds.
Fee Structures and Expense Ratios
Expense ratios directly impact long-term returns, especially for passive spot ETFs. While many major Bitcoin and Ethereum ETFs have lowered fees to compete, active strategies often carry higher costs. For example, the ARK 21Shares Active On-Chain Bitcoin Strategy ETF operates with a higher expense ratio than passive counterparts, reflecting the active management of on-chain signals. Investors must weigh whether the potential for alpha justifies the drag on net asset value (NAV). Lower fees generally favor buy-and-hold strategies, while higher fees may be acceptable for active funds aiming to outperform the market during volatile periods.
Liquidity and Trading Volume
Liquidity determines how easily you can enter or exit a position without significant slippage. High average daily volume ensures tighter bid-ask spreads, which is critical for large institutional trades. Some newer altcoin-linked ETFs, such as those tracking Solana, may have lower trading volumes compared to established Bitcoin funds. This can lead to wider spreads during market stress. Checking the 30-day average volume and the premium/discount to NAV helps gauge liquidity health. Funds with consistent inflows typically maintain better liquidity profiles.
Tracking Error and Premium/Discount
Tracking error measures how closely an ETF follows its underlying index or asset. Spot ETFs generally have low tracking errors, but active funds may deviate more due to management decisions. Premiums and discounts to NAV can also signal market sentiment. A persistent premium might indicate strong demand, while a discount could suggest selling pressure or liquidity issues. Monitoring these metrics helps identify mispricings and assess the fund's efficiency in replicating its benchmark.
Custody and Security Risks
The security of the underlying assets is paramount. ETFs use qualified custodians to hold the crypto assets, and the choice of custodian can affect risk profiles. Major providers often use regulated custodians with robust insurance and security protocols. However, the concentration of assets with a single custodian introduces counterparty risk. Understanding the custody structure helps investors assess the safety of their holdings. Transparent reporting on custody arrangements is a key indicator of a fund's reliability.
| Feature | Spot ETFs | Active ETFs |
|---|---|---|
| Expense Ratio | Low (often <0.50%) | Higher (often >0.75%) |
| Liquidity | High | Variable |
| Tracking | Close to NAV | May deviate |
| Complexity | Simple | Complex strategies |
Decision Framework
Choosing the right ETF depends on your investment goals. For long-term exposure with minimal cost, spot ETFs with low expense ratios and high liquidity are often the best choice. Active ETFs may suit investors seeking to capitalize on specific on-chain patterns, but they come with higher fees and complexity. Always compare the expense ratio, liquidity, and custody arrangements before investing. Understanding these tradeoffs helps you make informed decisions in the evolving crypto ETF landscape.
Choose the next step
Crypto ETF On-Chain Analysis works best as a clear sequence: define the constraint, compare the realistic options, test the tradeoff, and choose the path with the fewest hidden costs. That order keeps the advice usable instead of decorative. After each step, pause long enough to check whether the recommendation still fits the reader's actual situation. If it depends on perfect timing, unusual access, or a best-case budget, include a simpler fallback.
Watch for misleading claims and weak options
Spot Bitcoin ETF flows weakened earlier in 2026, but recent data suggests demand has started to stabilize. The price drop seems more significant than the volume changes, creating confusion for new entrants. Many investors mistake temporary volatility for structural failure, leading to panic selling when institutional accumulation is actually occurring. Track real-time on-chain data to distinguish between retail FUD and genuine institutional positioning.
The most dynamic area of best crypto ETFs 2026 is altcoin-linked products. Spot Solana ETFs have accumulated nearly $880 million, showing strong sector rotation. However, not all altcoin ETFs are created equal. Some track single assets with high fees, while others offer diversified exposure. Compare expense ratios and liquidity depth before committing capital. High fees can erode returns faster than market downturns.
Are there any blockchain ETFs? The iShares Blockchain and Tech ETF seeks to track the investment results of an index composed of U.S. and non-U.S. companies that are involved in the development, innovation, and utilization of blockchain and crypto technologies. This offers indirect exposure without custody risks. It is a safer entry point for traditional finance investors wary of direct crypto holdings. Evaluate whether you want direct asset exposure or equity-based growth.
What ETF will boom in 2026? The answer depends on your risk tolerance. Bitcoin remains the stable anchor, while Solana offers higher growth potential. Ethereum bridges the two with smart contract utility. Diversify across these three to balance risk. Avoid chasing obscure altcoin ETFs with low liquidity. They often suffer from wide bid-ask spreads and poor execution. Stick to products with deep order books and transparent fee structures.

No comments yet. Be the first to share your thoughts!