
How to read crypto ETF on-chain data
Tracking Solana and Ethereum spot ETF inflows requires looking past headline numbers. On-chain data provides the raw ledger of every transaction, offering a granular view that standard financial reports often smooth over. For investors, this transparency is the difference between seeing a static snapshot and understanding the actual movement of capital.
The primary challenge is volume. Unlike traditional equity markets where settlement is standardized, crypto ETFs interact with blockchain networks that process thousands of transactions per second. When tracking inflows, you are not just watching a bank account balance; you are monitoring a distributed ledger where confirmation times and network congestion can delay visibility. This lag means real-time "live" data is often an estimate until the block is fully finalized.
To get accurate inflow figures, you must distinguish between the ETF issuer's reported AUM (Assets Under Management) and the actual on-chain holdings. Issuers like BlackRock or Fidelity may report net flows based on creation/redemption units, but verifying these against on-chain wallet activity confirms whether the assets are truly sitting in custody or moving through the network. Using tools that aggregate this data helps filter out noise, allowing you to focus on the genuine accumulation or distribution patterns of institutional capital.
Crypto ETF on-chain data choices that change the plan
Tracking on-chain data for spot crypto ETFs requires balancing visibility against data latency and structural complexity. While real-time blockchain metrics offer granular insight into wallet movements, they do not always reflect immediate fund creation or redemption events, which are processed through traditional custodial rails.
Tracking Accuracy and Latency
On-chain data provides a transparent ledger of asset movements, but ETF inflows often involve off-chain settlement periods. Coin Metrics and similar providers bridge this gap by correlating exchange deposits with actual blockchain withdrawals, yet a lag remains between the trade execution and the on-chain confirmation. This delay can distort short-term flow analysis, making it difficult to distinguish between speculative positioning and genuine accumulation.
Custodial Structure and Visibility
Different ETF issuers use varying custodial structures, affecting how easily on-chain holdings can be tracked. BlackRock’s IBIT and Fidelity’s FBTC hold assets with primary custodians like Coinbase Custody and BitGo, respectively. These relationships mean that on-chain wallet addresses change over time as custodians rotate cold storage, requiring constant updates to tracking models. Without accurate address mapping, on-chain data may underreport total holdings or misattribute movements to unrelated entities.
Data Source Reliability
Not all on-chain data providers offer the same level of precision for ETF-specific metrics. Some sources aggregate data from multiple block explorers, while others rely on proprietary node infrastructure. For spot Bitcoin and Ethereum ETFs, using a provider like The Block or Coin Metrics ensures that flow data is validated against exchange-level transaction records. Relying on unverified or aggregated data can lead to inaccurate conclusions about market sentiment and capital rotation.
| Factor | On-Chain Data | Fund Flow Reports | Custodian Reports |
|---|---|---|---|
| Timeliness | Real-time (block-level) | Daily (T+1) | Quarterly |
| Accuracy | High (verified transactions) | High (audited) | High (audited) |
| Granularity | Wallet-level detail | Aggregate net flows | Aggregate holdings |
| Complexity | Requires address mapping | Straightforward | Straightforward |
| Coverage | Limited to on-chain assets | All ETFs | All ETFs |
Build your on-chain ETF tracking framework
Spot ETF approval shifted the market from speculation to data-driven allocation. You can no longer rely on price action alone. The real signal lives in the flow data that tracks institutional behavior across Solana and Ethereum networks.
Use this step-by-step approach to interpret on-chain metrics and make allocation decisions that reflect actual capital movement rather than retail sentiment.
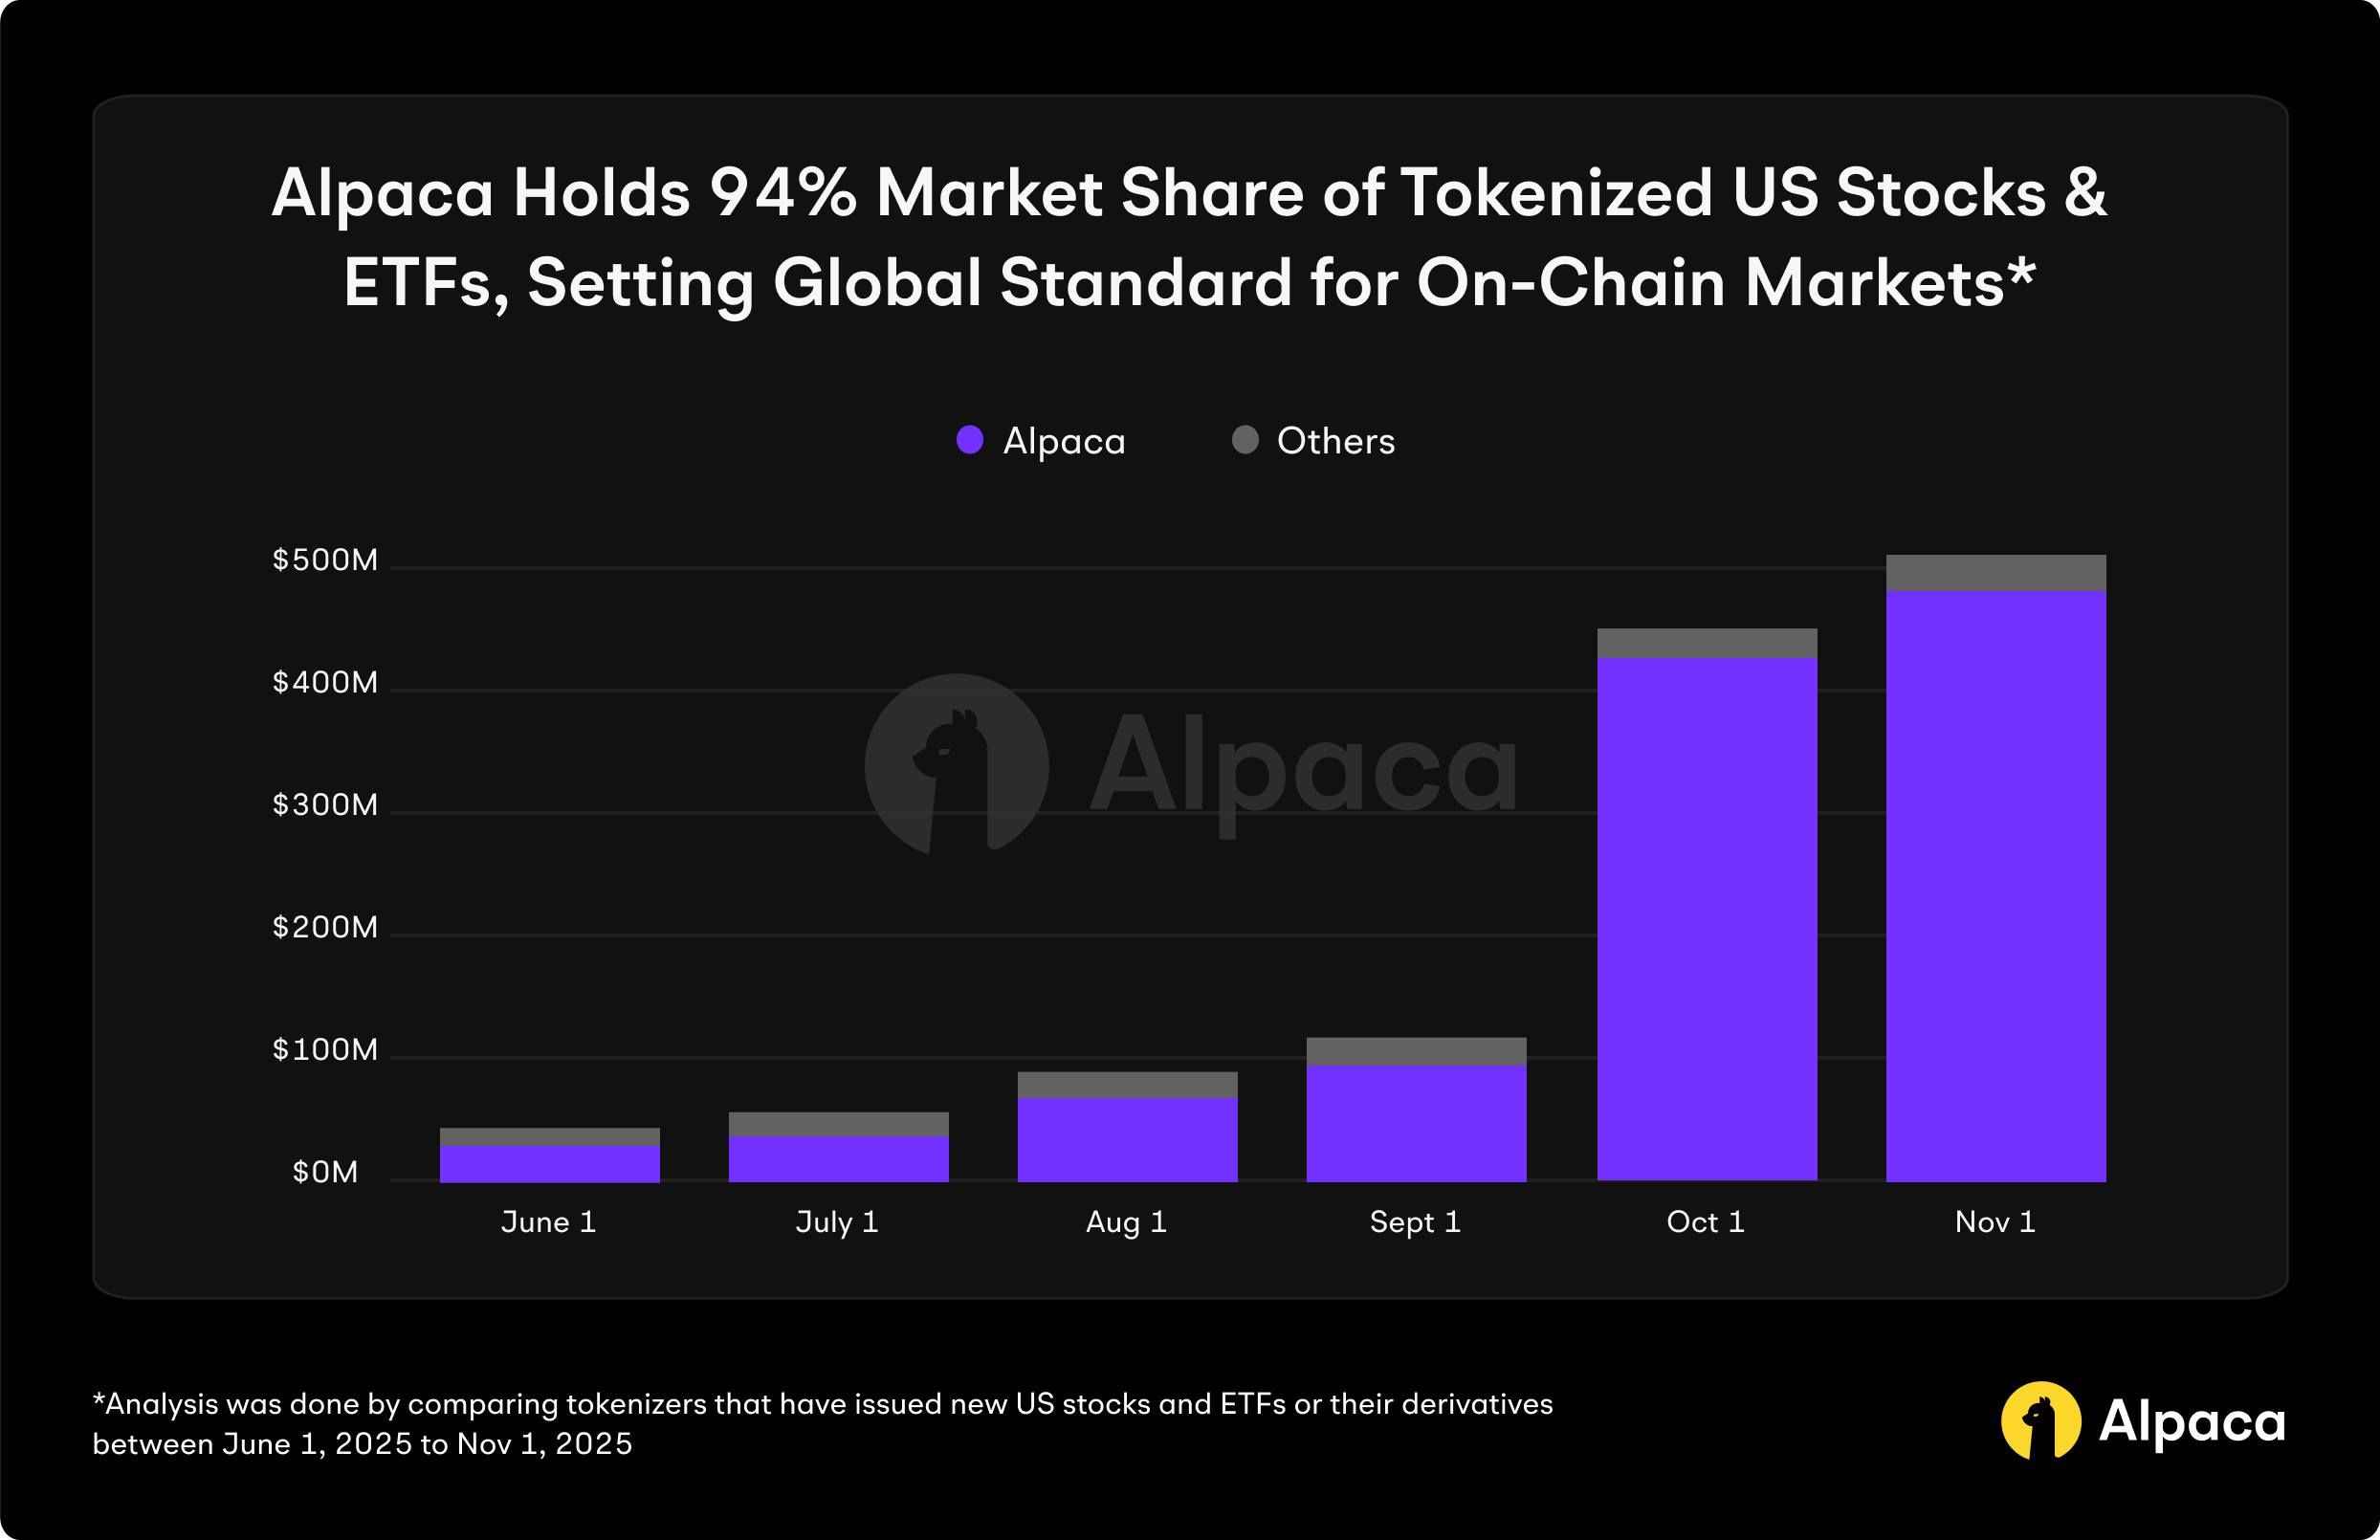
Start with established trackers like The Block or CryptoQuant. These platforms aggregate raw blockchain data into usable daily flow reports for major issuers. Avoid secondary aggregators that may lag or lack transparency in their methodology.
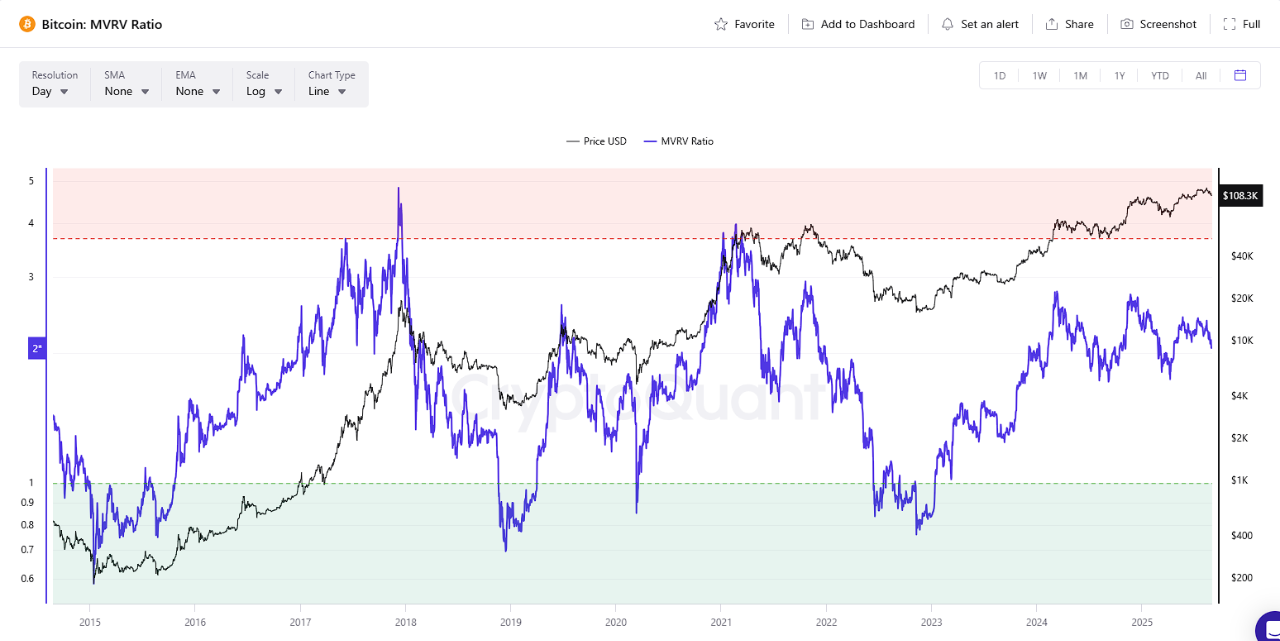
Track the difference between shares redeemed and issued. Sustained positive net inflows indicate institutional accumulation, while consecutive outflows often precede price corrections. Look for trends over 3-5 days to filter out daily noise.
Identify which issuers are capturing the majority of new capital. BlackRock IBIT and Fidelity FBTC typically dominate volume. A shift in market share toward a smaller issuer can signal early institutional interest in a specific product structure or fee tier.
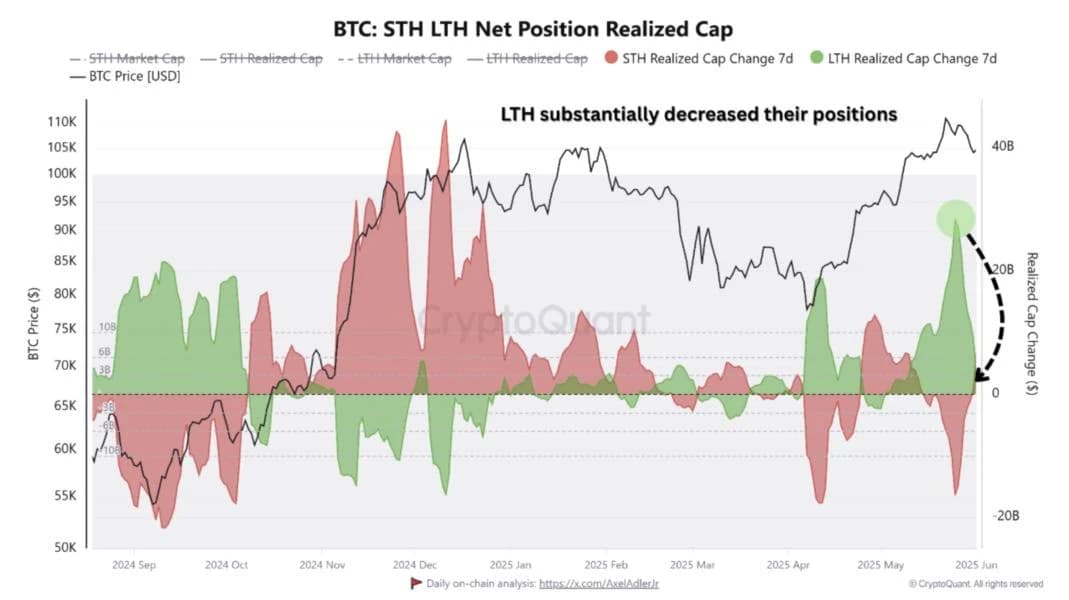
Cross-reference ETF inflows with Solana and Ethereum network metrics. High ETF inflows combined with rising active addresses or staking deposits suggest strong fundamental demand. Divergence between price and on-chain activity often warns of a potential reversal.
| Metric | Significance | Investor Action |
|---|---|---|
| Net Inflow | Capital direction | Follow positive trends |
| Market Share | Issuer strength | Track dominant players |
| Active Addresses | Network health | Verify fundamental demand |
Watchouts: Misleading Claims and Weak Options
Real-time tracking of Solana and Ethereum spot ETF inflows requires distinguishing between actual on-chain data and aggregated market estimates. Many platforms display "inflows" that are actually net asset value (NAV) changes or futures-based proxies, which do not reflect the same liquidity dynamics as spot holdings. Always verify the data source against official custodian reports or primary exchange filings to avoid acting on stale or aggregated metrics.
Weak Options to Avoid
Some tracking tools rely on delayed APIs or third-party aggregators that fail to capture intraday volatility accurately. These weak options often lag by hours, making them useless for real-time decision-making. Look for providers that integrate directly with on-chain explorers or licensed data terminals like Glassnode or Dune Analytics for accurate, granular insights. Avoid generic financial news sites that summarize daily flows without providing the underlying transactional data.
Common Mistakes in On-Chain Analysis
A frequent error is conflating on-chain wallet activity with ETF-specific inflows. ETFs operate through authorized participants (APs) and custodians, meaning their on-chain movements are distinct from retail wallet transactions. Misinterpreting large transfers between exchange wallets as ETF inflows leads to false signals. Focus on specific custodian addresses and authorized participant activity to isolate genuine ETF flows. Additionally, be wary of platforms that do not clearly label their data sources or update frequency, as this can lead to significant misinterpretation of market sentiment.
Verifying Data Integrity
To ensure accuracy, cross-reference real-time inflow data with official SEC filings and custodian statements. This step is crucial for identifying discrepancies between reported flows and actual on-chain movements. Always prioritize data providers that offer transparent methodologies and direct access to primary sources. By focusing on verified, real-time on-chain data, you can make more informed decisions regarding Solana and Ethereum spot ETF investments.
Crypto ETF on-chain data: what to check next
What are the top 5 crypto ETFs?
The spot Bitcoin and Ethereum ETFs dominate current inflow metrics by a wide margin. BlackRock's IBIT leads in assets under management, followed closely by Fidelity's FBTC and Grayscale's GBTC. For Ethereum exposure, BlackRock's ETHA and Fidelity's FETH are the primary choices. These five funds account for the majority of daily on-chain tracking volume and liquidity.
Is there an ETF for blockchain?
Yes, but these funds track equity, not digital assets directly. The iShares Blockchain and Tech ETF (IBLC) is a prominent example. It invests in U.S. and non-U.S. companies involved in blockchain development and crypto technology utilization. This approach offers indirect exposure to the sector's growth without the volatility of holding the underlying tokens.
What is on-chain data for crypto?
On-chain data refers to the transparent, immutable record of transactions stored on a blockchain. For ETFs, this includes tracking the actual movement of Bitcoin or Ethereum into custody wallets managed by authorized participants. It provides real-time visibility into inflows and outflows, allowing investors to verify holdings beyond standard financial reports.
Is there an Onchain crypto ETF?
The VanEck Onchain Economy ETF (NODE) focuses on the infrastructure supporting the on-chain economy. It is an actively managed fund investing in companies tied to blockchain infrastructure, digital asset services, and digital asset exposure. While it does not hold crypto directly, it captures the value of the ecosystem's growth through equity positions.

No comments yet. Be the first to share your thoughts!