
Crypto ETF on-chain analysis
Tracking spot crypto ETF flows has become a primary signal for institutional sentiment in 2026. Unlike retail trading, ETF on-chain analysis reveals large-scale capital movements that often precede broader market shifts. By monitoring daily net inflows and outflows, investors can gauge whether institutions are accumulating or distributing assets.
Bitcoin and Ethereum spot ETFs dominate the market, with BlackRock and Fidelity controlling 72% of spot bitcoin assets. This concentration means that flow data from these major issuers provides a reliable proxy for overall institutional demand. When inflows surge, it often signals confidence in the asset’s long-term value, while sustained outflows can indicate profit-taking or risk aversion.
On-chain metrics also highlight whale accumulation patterns. Large holders, often affiliated with ETF issuers or custodians, tend to accumulate during periods of low volatility. Analyzing these patterns helps distinguish between short-term speculation and strategic positioning. For 2026, the focus remains on identifying sustained accumulation trends rather than reacting to daily price fluctuations.
| Issuer | Asset | Market Share | Flow Trend |
|---|---|---|---|
| BlackRock | BTC | ~40% | Stable Inflow |
| Fidelity | BTC | ~32% | Stable Inflow |
| Grayscale | BTC | ~15% | Declining |
| BlackRock | ETH | ~35% | Growing |
| Fidelity | ETH | ~30% | Growing |
Crypto etf on-chain analysis choices that change the plan
On-chain data provides a transparent window into crypto ETF mechanics, but it comes with distinct limitations. Unlike traditional mutual funds, crypto ETFs do not publish daily holdings reports. Instead, investors must rely on blockchain verification to confirm whether the fund is actually holding the underlying assets. This creates a tradeoff between transparency and operational opacity.
The primary benefit is verifiable solvency. By tracking the fund’s custodial wallet addresses, you can confirm that the tokens backing the ETF shares exist and are secured. This is a powerful check against fraud or mismanagement. However, on-chain data alone cannot reveal the fund’s internal cost structure, tax efficiency, or the specific trading strategies used by authorized participants to create and redeem shares.
Comparison of Key Metrics
The table below compares the primary on-chain and operational metrics for major spot crypto ETFs. These figures illustrate the tradeoffs between cost, size, and transparency.
| Metric | Spot Bitcoin ETF | Spot Ethereum ETF |
|---|---|---|
| Primary On-Chain Check | Custodial wallet balance verification | Custodial wallet balance verification |
| Fee Range (Expense Ratio) | 0.15% - 0.25% | 0.25% - 0.40% |
| Data Transparency | High (public blockchain) | |
| Liquidity Depth | High (deep order books) | Moderate (dependent on volume) |
| Operational Insight | Low (no daily holdings) | Low (no daily holdings) |
Evaluating the choices that change the plan
When analyzing these funds, you must balance the clarity of on-chain data with the reality of market structure. High volume in Bitcoin ETFs often correlates with tighter spreads and lower slippage, making them more efficient for large trades. Ethereum ETFs, while growing, may still experience wider bid-ask spreads during volatile periods, which can erode returns for active traders.
Also, on-chain analysis cannot predict short-term price movements driven by sentiment or macroeconomic news. The data only confirms the presence of assets, not the momentum of the market. For long-term holders, the low fees and verified custody of spot ETFs outweigh the lack of daily operational details. For traders, the liquidity and spread efficiency are the more critical factors to monitor.
Choose the next step
Crypto ETF On-Chain Deep Dive works best as a clear sequence: define the constraint, compare the realistic options, test the tradeoff, and choose the path with the fewest hidden costs. That order keeps the advice usable instead of decorative. After each step, pause long enough to check whether the recommendation still fits the reader's actual situation. If it depends on perfect timing, unusual access, or a best-case budget, include a simpler fallback.

Spotting the Weak Links in Crypto ETF Narratives
The 2026 landscape for crypto ETFs is defined by consolidation rather than expansion. While headlines often highlight new launches, the reality is that investor demand is heavily concentrated. BlackRock and Fidelity now control approximately 72% of spot Bitcoin assets, leaving many alternative funds vulnerable to closure. Analysts predict that up to a third of the ETFs launched since early 2024 may shut down within the next two years as capital migrates to the lowest-cost, highest-liquidity options.
Ethereum’s Structural Advantage
When evaluating which crypto is expected to boom in 2026, Ethereum (ETH) stands out for its utility. Having grown from $2.83 at launch to roughly $1,875 by mid-2026, ETH has demonstrated a 66,134% increase driven by its role as the backbone for decentralized applications (DApps). Unlike pure store-of-value assets, Ethereum’s ecosystem provides tangible demand for its token through network fees and staking, making its associated ETFs more resilient to speculative volatility.
The Cost Trap
Many investors fall for the trap of chasing high-profile launches with poor fee structures. The "best" ETF for 2026 is often the one that minimizes drag on long-term returns. Grayscale’s 2026 Digital Asset Outlook emphasizes that institutional adoption is driven by cost efficiency and regulatory clarity. Investors should scrutinize expense ratios closely; even a 0.5% difference can significantly erode gains over a multi-year hold.
Tracking Real Money
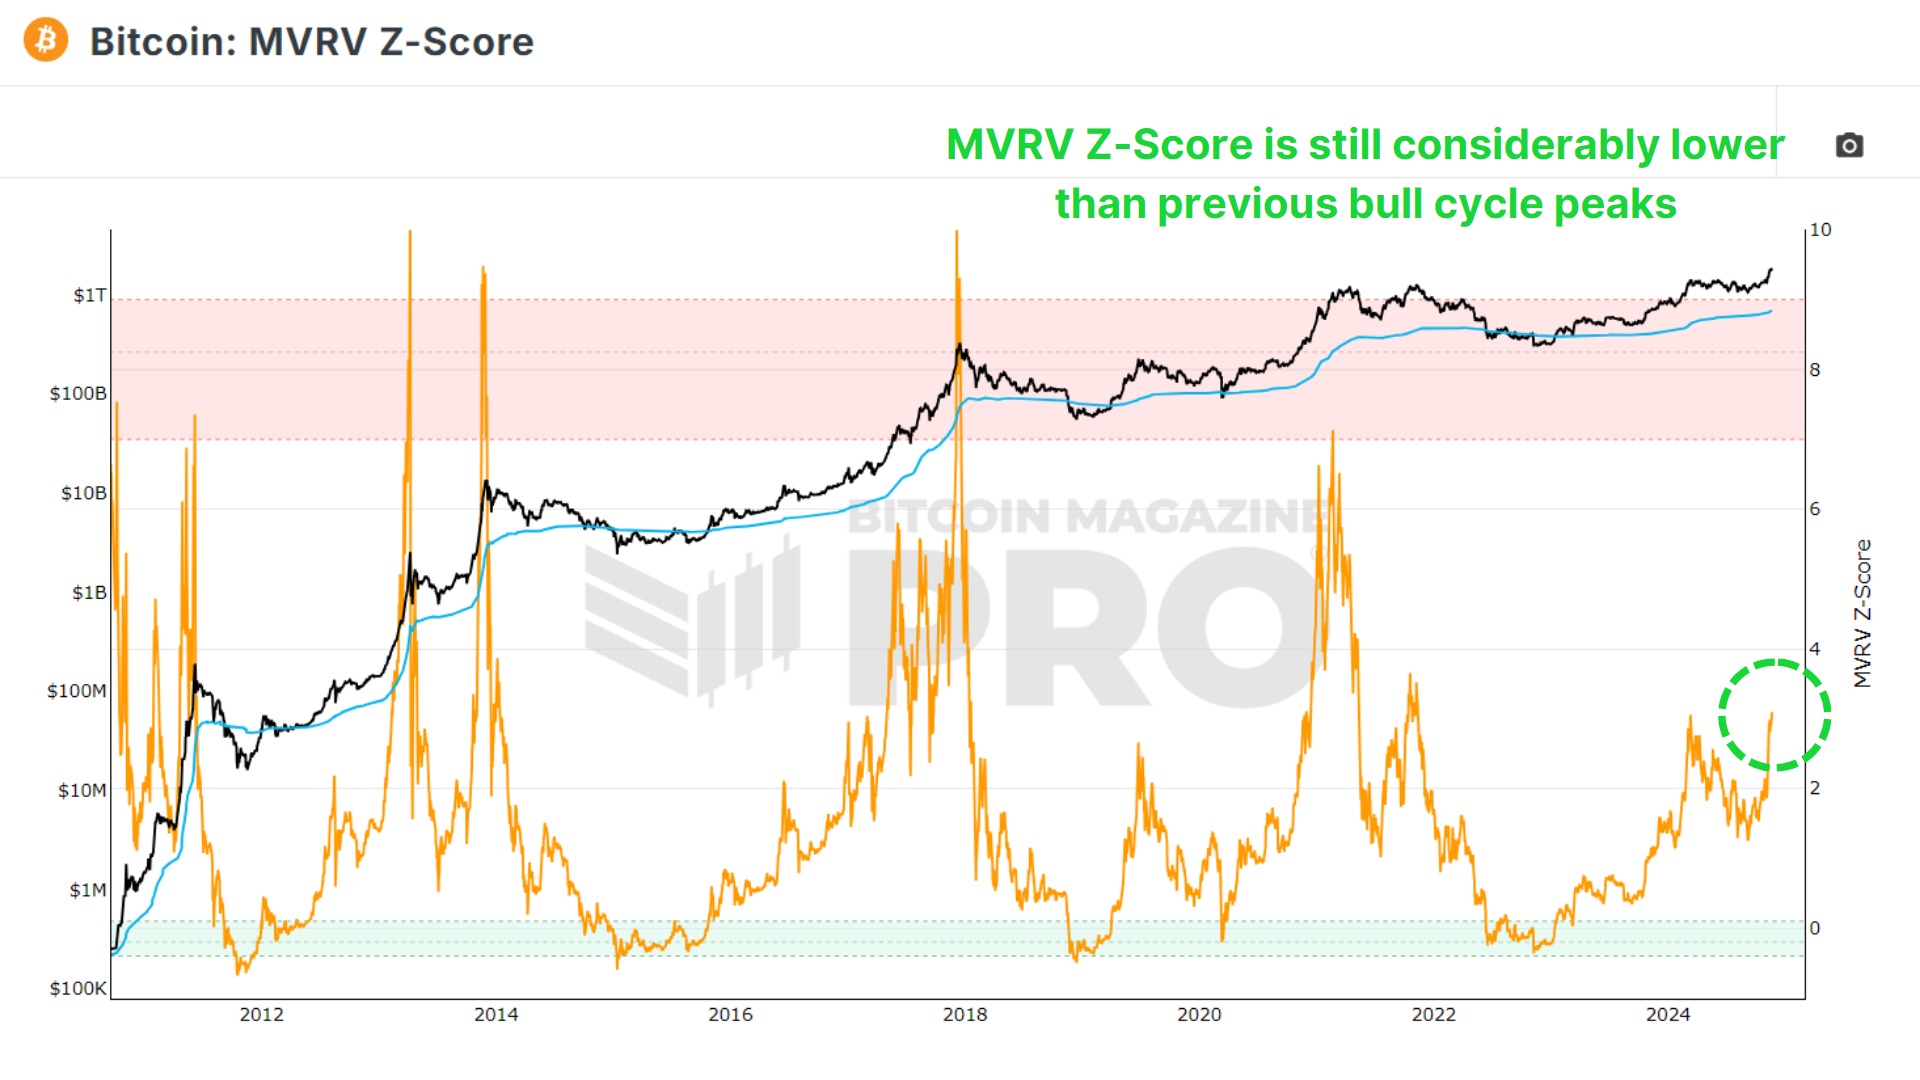
On-chain data reveals that "whale accumulation" is not just about buying dips. It is about accumulating during periods of low volatility when retail interest is low. Use the charts below to monitor these trends against broader market movements. This helps distinguish between genuine institutional positioning and short-term speculation.
Crypto etf on-chain analysis 2026: what to check next
Tracking real-time on-chain flows helps distinguish between speculative noise and genuine accumulation. By focusing on the primary assets—Bitcoin and Ethereum—you can avoid the trap of chasing underperforming altcoin ETFs that lack the liquidity to sustain long-term growth.

No comments yet. Be the first to share your thoughts!