
What crypto ETF on-chain data reveals
Tracking crypto ETF on-chain data requires separating the financial ledger from the blockchain ledger. When an investor buys shares in a Bitcoin ETF, they transact within traditional markets, but the fund manager must simultaneously move actual Bitcoin from cold storage to an exchange wallet to settle those shares. This dual-layer activity creates a distinct on-chain footprint that differs from spot market trading.
On-chain metrics for ETFs focus on the movement of custodied Bitcoin rather than secondary market price action. Data providers like Coin Metrics and Dune Analytics track deposits and withdrawals from addresses identified as ETF custodians. These movements signal whether institutional capital is accumulating or distributing the underlying asset. Monitoring these flows helps distinguish between passive index tracking and active rebalancing.
The scope of this data extends beyond simple inflow numbers. Analysts use on-chain insights to calculate the total BTC supply held by ETFs and monitor shifts in ETF dominance relative to circulating supply. As of early 2026, the total BTC supply held by US Spot Bitcoin ETFs exceeds 500,000 BTC, representing a significant portion of the available network liquidity.
Understanding these mechanics allows investors to see the actual accumulation of institutional holdings. While price charts show sentiment, on-chain ETF data reveals the physical movement of the asset that backs those financial instruments.
Tracking custody addresses and supply shifts
Spot Bitcoin ETFs are not opaque black boxes. The custodians holding the underlying BTC—such as Coinbase Custody for BlackRock’s IBIT or Fidelity Digital Assets for FBTC—post their holdings on-chain daily. By monitoring these specific wallet addresses, analysts can track real-time accumulation or distribution, offering a clearer view of institutional demand than price action alone.
This data reveals the actual volume of Bitcoin being secured by regulated entities. When custody balances rise, it signals that ETF shares are being purchased and the underlying assets are being moved off exchanges into long-term storage. Conversely, drops in these balances often precede sell-offs, as ETF issuers redeem shares and the BTC is liquidated or moved to exchanges for sale.
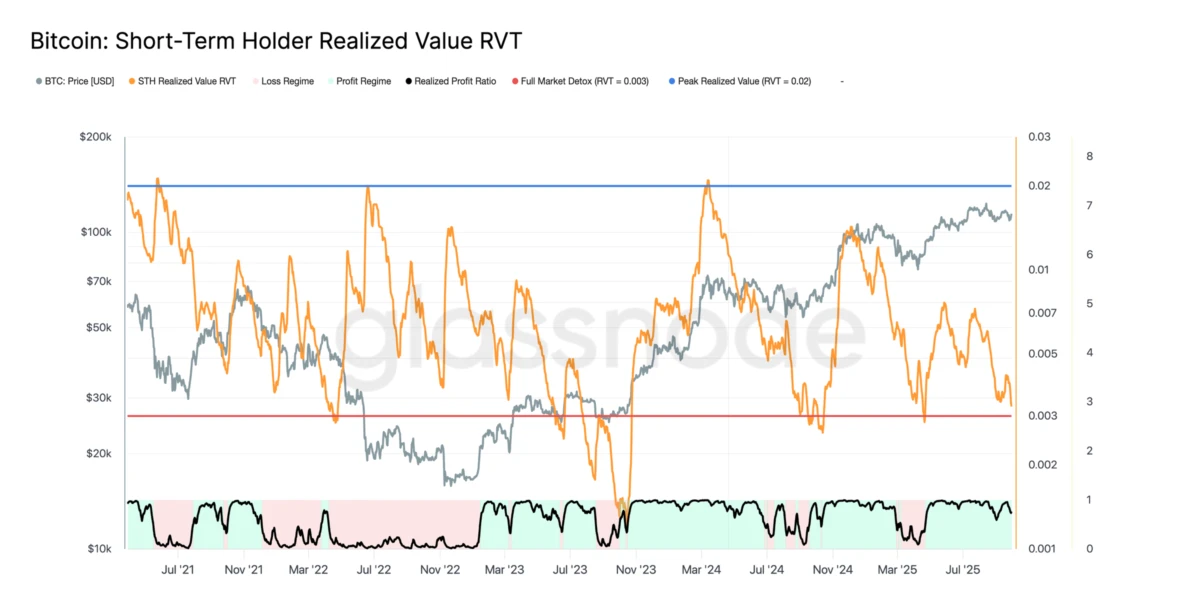
Platforms like Dune Analytics provide dashboards that aggregate these custody movements, allowing investors to see which funds are buying and which are selling. This transparency transforms ETF flows from a daily headline into a continuous stream of on-chain evidence, helping traders distinguish between short-term speculation and genuine institutional conviction.


As an Amazon Associate, we may earn from qualifying purchases.
Top tools for monitoring ETF flows
Tracking Bitcoin ETF activity requires more than watching the price ticker. Institutional flows leave distinct on-chain footprints—custodian deposits, cold storage shifts, and net issuance changes—that reveal where smart money is moving. While general market data is widely available, specialized platforms offer the granular visibility needed to distinguish between retail noise and institutional positioning.
Three providers stand out for their specific approaches to ETF on-chain insights: Coin Metrics, Dune Analytics, and The Block. Each offers different strengths depending on whether you need raw transaction data, customizable dashboards, or aggregated institutional metrics.
Coin Metrics: Precision on Supply and Dominance
Coin Metrics specializes in high-fidelity data infrastructure. Their ETF On-Chain Insights platform tracks individual and aggregate flows with a focus on supply dynamics. Users can monitor the aggregate Bitcoin supply held by ETFs and analyze shifts in ETF dominance over time. This is particularly useful for understanding how much of the circulating supply is being locked away by institutional vehicles.
Dune Analytics: Customizable Custodian Tracking
Dune Analytics provides a flexible environment for building and sharing custom dashboards. Their Bitcoin ETF dashboard tracks on-chain deposits and withdrawals of addresses identified as custodians of major Bitcoin ETFs. This approach allows users to see real-time movement of funds into and out of custodial wallets, offering a more granular, transaction-level view than aggregated AUM data alone.
The Block: Aggregated Flows and AUM
The Block offers a streamlined dashboard for monitoring all US spot Bitcoin ETFs, including BlackRock IBIT, Fidelity FBTC, and Grayscale GBTC. Their platform aggregates daily flows, assets under management (AUM), and trading volumes. This is ideal for users who need a quick, consolidated view of the broader ETF landscape without digging into raw transaction data.
Comparison of Key Features
The following table compares the core capabilities of these three platforms to help you choose the right tool for your analysis.
| Provider | Primary Focus | Data Type | Best For |
|---|---|---|---|
| Coin Metrics | Supply & Dominance | On-chain & Aggregated | Understanding ETF lock-up ratios |
| Dune Analytics | Custodian Movements | Raw Transaction Data | Tracking specific wallet activity |
| The Block | Market Overview | Aggregated Flows & AUM | Quick daily flow checks |
Reading the flow of institutional capital
Tracking daily net inflows and outflows for spot Bitcoin ETFs provides a real-time pulse on institutional sentiment, but the numbers require context. A day of heavy inflows into funds like BlackRock's IBIT or Fidelity's FBTC signals active accumulation, while outflows from legacy vehicles like GBTC often reflect profit-taking or rebalancing rather than a loss of faith in the asset class.
To interpret these flows accurately, you must correlate them with on-chain supply shocks. When ETF inflows coincide with a decrease in exchange balances, it suggests institutions are moving assets into cold storage, reducing liquid supply and potentially tightening market float. Conversely, if inflows are stagnant but exchange balances rise, it may indicate that previously held assets are being prepared for sale.
The relationship between ETF flows and on-chain metrics acts as a confirmation signal. Strong inflows paired with rising holder counts on-chain suggest broad-based institutional adoption. In contrast, inflows driven by a few large entities might create volatility without sustainable demand. Understanding this dynamic helps distinguish between temporary market noise and structural shifts in Bitcoin's institutional footprint.
Common questions about ETF on-chain metrics
Investors tracking institutional flows often confuse direct Bitcoin exposure with broader thematic plays. Understanding the difference between spot ETFs, blockchain equity funds, and on-chain data is essential for accurate market analysis.

No comments yet. Be the first to share your thoughts!