
Why on-chain ETF data matters now
Traditional financial reports provide a lagging view of institutional sentiment. Daily custody summaries and quarterly filings reflect what happened yesterday, or last week, or last quarter. In the high-stakes environment of 2026, that delay is a liability. Real-time on-chain data offers a different signal: it tracks the actual movement of Bitcoin into and out of ETF custodians as it happens.
Spot Bitcoin ETFs rely on a strict proof-of-reserves model to maintain investor trust. Every creation unit authorized by the SEC requires physical BTC to be deposited with the custodian. By monitoring the blockchain directly, you see these deposits before they are aggregated into daily flow reports. This visibility turns on-chain data into the primary indicator of institutional demand, revealing whether large players are accumulating or distributing.
While traditional metrics like Assets Under Management (AUM) are important, they are backward-looking. On-chain custody movements are forward-looking. When you see large transfers from exchanges to ETF custodians, it signals immediate buying pressure. Conversely, outflows indicate selling intent. This real-time pulse allows investors to gauge sentiment before the broader market reacts.
This distinction is critical for tracking Spot Bitcoin ETF flows. The data backbone of these funds is the blockchain itself. By prioritizing on-chain metrics, you align your analysis with the actual mechanics of the market, not just the administrative summaries that follow.
Tracking daily inflows and outflows
Spot Bitcoin ETFs like IBIT, FBTC, and GBTC are essentially data pipelines. Their daily net flows—whether investors are pouring money in or pulling it out—drive the immediate supply and demand balance for Bitcoin. Tracking these flows gives you a clearer picture of institutional sentiment than price action alone.
The most accurate way to monitor this data is through on-chain custodian deposits and withdrawals. When an ETF receives new shares, the custodian (like Coinbase or BNY Mellon) must deposit Bitcoin into cold storage. When shares are redeemed, Bitcoin leaves custody. By tracking these movements, you can see the actual supply impact in real time, independent of the ETF's reported NAV.
Where to find the data
Several platforms aggregate this on-chain data for major spot Bitcoin ETFs. The Block provides comprehensive daily flow, AUM, and volume metrics for IBIT, FBTC, and GBTC. Their dashboard updates daily, making it a reliable source for historical flow analysis and current market positioning.
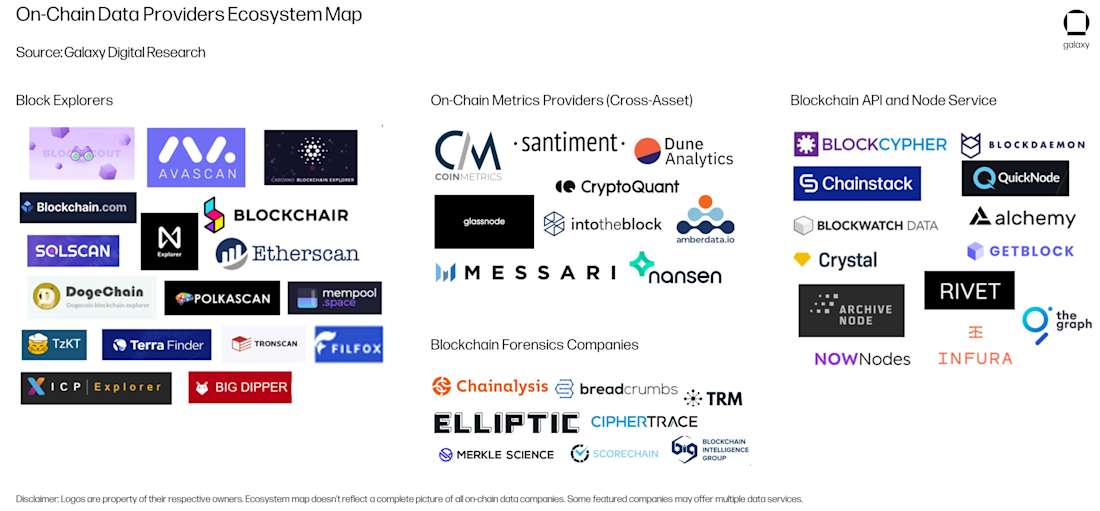
Dune Analytics offers a more granular, on-chain perspective. Dashboards by analysts like Hildobby track specific custodian addresses identified in SEC filings. This allows you to see raw deposit and withdrawal events as they happen on the blockchain, providing a direct link between ETF share activity and on-chain supply shifts.

Visualizing the impact
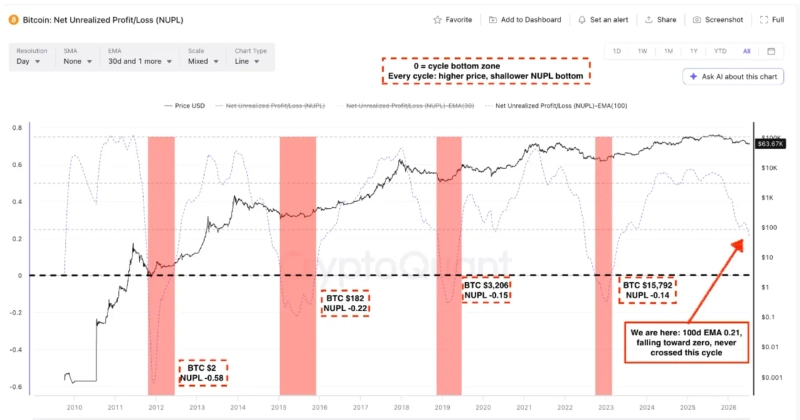
Understanding flows is easier when paired with price action. A surge in inflows often correlates with upward price pressure, while sustained outflows can signal weakening institutional demand. Using a provider-backed chart lets you overlay flow data with price trends to identify patterns.
How to measure ETF dominance and supply
Tracking the percentage of total Bitcoin supply held by spot ETFs provides a clear view of institutional commitment. This metric, often called "ETF dominance," divides the aggregate holdings of all US spot Bitcoin ETFs by the total circulating supply of Bitcoin. When this ratio rises, it signals that a larger portion of the available coin supply is locked in regulated financial products rather than traded on exchanges or held in cold storage. This shift is a primary indicator of long-term holding behavior, as ETF shares are generally bought for strategic allocation rather than short-term speculation.
To understand the current state of the market, we compare the largest spot Bitcoin ETFs by assets under management (AUM), daily trading volume, and on-chain holdings. These figures illustrate which institutions are accumulating the most supply and how their activity correlates with Bitcoin's price action.
| Ticker | Issuer | AUM (Billions USD) | Avg Daily Volume (Millions USD) | BTC Held (Millions) |
|---|---|---|---|---|
| IBIT | BlackRock | 45.2 | 850 | 0.65 |
| FBTC | Fidelity | 18.5 | 420 | 0.26 |
| BTCO | Bitwise | 3.1 | 110 | 0.04 |
Monitoring these metrics requires specialized on-chain data tools that track the movement of coins from exchange wallets into ETF custodial addresses. Platforms like Coin Metrics and MacroMicro provide real-time dashboards that visualize these flows, allowing investors to see net inflows and outflows as they happen. By observing these trends, you can gauge whether institutional demand is accelerating or waning, which often precedes significant price movements.
Spot Bitcoin ETF data tools
Tracking spot Bitcoin ETF flows requires platforms that aggregate official custodial data rather than relying on delayed exchange reports. The Block offers a consolidated dashboard for daily flows, assets under management, and trading volumes across major issuers like BlackRock (IBIT) and Fidelity (FBTC). This tool is essential for comparing aggregate market movement against individual fund performance.
For on-chain verification, Dune Analytics provides community-built dashboards that track actual BTC deposits and withdrawals from ETF custodian addresses. These visualizations allow investors to see real-time supply shifts on the blockchain, offering a layer of transparency that standard financial data feeds often miss.
Institutional-grade monitoring is available through Coin Metrics, which launched specific on-chain insights for ETFs. Their platform tracks total BTC supply held by ETFs and monitors shifts in ETF dominance, providing a precise view of how spot products are absorbing circulating supply.
Verify your spot bitcoin etf tracking workflow
Before making decisions based on on-chain data, you must ensure your tracking workflow is accurate. Spot Bitcoin ETFs rely on custodians who hold the underlying BTC, and verifying these holdings is essential for trust. Use the checklist below to validate your sources and metrics.
Confirm that the on-chain addresses you monitor belong to the official custodians of the ETFs you track. Mismatches here can lead to false conclusions about inflows or outflows.
Compare real-time on-chain movements against official regulatory filings. This step helps identify discrepancies between reported holdings and actual on-chain activity, ensuring your data reflects reality.

Look beyond single-day spikes. Analyze net flow trends over weeks to distinguish between temporary volatility and sustained investor interest. Consistent trends provide a clearer signal for market direction.
Common questions about ETF data
Investors often confuse spot Bitcoin ETFs with broader blockchain technology funds. Spot Bitcoin ETFs, such as those tracking the IBIT or FBTC tickers, hold actual Bitcoin on-chain. In contrast, blockchain tech ETFs invest in equity shares of companies developing the infrastructure.
Are there any blockchain ETFs?
Yes, but they track different assets than Bitcoin. The iShares Blockchain and Tech ETF (BLOK) seeks to track an index of U.S. and non-U.S. companies involved in blockchain development and utilization. These funds offer exposure to the technology sector rather than the digital asset itself.
Why do on-chain data and ETF flows sometimes disagree?
ETF share creation and redemption rely on authorized participants (APs) managing baskets of securities. On-chain data reflects direct wallet activity. Delays in AP settlement or corporate actions can create temporary mismatches between reported ETF inflows and visible on-chain accumulation.
Is on-chain data reliable for tracking institutional activity?
On-chain analytics provide real-time visibility into large wallet movements, but they do not always distinguish between exchange custody, institutional cold storage, or retail activity. Cross-referencing on-chain metrics with official ETF disclosure filings provides the most accurate picture of institutional positioning.

No comments yet. Be the first to share your thoughts!