Spot Bitcoin ETF net inflows stabilize
Spot Bitcoin ETF flows weakened earlier in 2026, but recent data suggests demand has started to stabilize. After a turbulent start to the year marked by significant outflows, the market is showing signs of structural maturity. This stabilization is not just a return to previous highs but reflects a fundamental shift in how institutional capital interacts with the asset class.
The price drop seen in early 2026 was more significant than the outflow data alone might suggest. However, on-chain metrics indicate that the market is absorbing this supply shock differently than in previous cycles. Institutions are now actively absorbing the exchange float, reducing the liquid supply available on public order books. This structural change means that even modest inflows can have a disproportionate impact on price stability, as the buffer of exchange-held Bitcoin shrinks.
This dynamic is visible when comparing the IBIT price action with broader Bitcoin volatility. The correlation between ETF inflows and price action remains strong, but the lag time has decreased. As institutions continue to accumulate through these vehicles, the market is becoming less sensitive to short-term retail sentiment and more responsive to long-term structural demand. This shift marks a new phase for the Bitcoin ETF landscape, where stability is derived from deep institutional participation rather than speculative frenzy.
Ethereum ETF institutional demand shifts
Institutional capital is rotating into Ethereum ETFs as the 2026 narrative shifts from pure speculation to utility. BlackRock’s ETHA and Fidelity’s FETH are capturing the bulk of this demand, driven by a broader market consensus that real-world asset (RWA) tokenization and decentralized finance (DeFi) integration will unlock significant value. Unlike earlier cycles focused on price action alone, current flows reflect a structural bet on Ethereum’s role as the settlement layer for institutional finance.
The price impact analysis for Ethereum ETFs suggests that sustained inflows into ETHA and FETH could push ETH toward the $7,000–$11,000 range. This target is not based on isolated trading volume but on the cumulative effect of institutional adoption of tokenized assets. As more traditional finance entities move on-chain, the demand for regulated Ethereum exposure through ETFs becomes a primary conduit for capital entry, reducing sell-side pressure and stabilizing long-term valuation.
Tracking on-chain data reveals that these inflows are increasingly correlated with DeFi protocol growth rather than short-term arbitrage. Investors are using ETF shares as a stable holding vehicle while the underlying Ethereum ecosystem expands its tokenization capabilities. This dynamic creates a feedback loop: higher ETF demand supports the price, which incentivizes more developers and institutions to build on-chain, further justifying the institutional allocation.
| ETF | Issuer | 2026 Driver |
|---|---|---|
| ETHA | BlackRock | Institutional RWA Tokenization |
| FETH | Fidelity | DeFi Integration & Yield |
Comparing Top Crypto ETF Contracts
Selecting the right crypto ETF depends on whether you prioritize low fees, high liquidity, or specific asset exposure. In 2026, the market has consolidated around five major contracts that dominate institutional and retail flows. BlackRock and Fidelity lead the Bitcoin and Ethereum categories, while Morgan Stanley and Grayscale offer distinct alternatives for cost-conscious or diversified investors.
The table below compares the five leading spot crypto ETFs by Assets Under Management (AUM), expense ratio, and recent 30-day net flows. These metrics reflect current institutional preferences and capital movement trends.
| Ticker | Issuer | Asset | Expense Ratio | AUM (Est.) | 30d Net Flows |
|---|---|---|---|---|---|
| IBIT | BlackRock | Bitcoin | 0.25% | $85B | +$12.5B |
| MSBT | Morgan Stanley | Bitcoin | 0.15% | $18B | +$3.2B |
| ETHA | BlackRock | Ethereum | 0.25% | $14B | +$1.8B |
| FETH | Fidelity | Ethereum | 0.25% | $11B | +$1.1B |
| GDLC | Grayscale | Multi-Asset | 0.50% | $4B | +$0.5B |
IBIT remains the dominant force in Bitcoin ETFs, benefiting from BlackRock’s distribution network and deep liquidity. MSBT has gained traction among cost-sensitive investors by offering the lowest expense ratio among major Bitcoin ETFs. For Ethereum exposure, ETHA and FETH compete closely, with BlackRock holding a slight edge in total AUM.
GDLC stands apart as a multi-asset solution, providing broader diversification beyond a single cryptocurrency. While its expense ratio is higher, it appeals to investors seeking a single vehicle for multiple digital assets. Recent flows indicate steady, albeit smaller, interest compared to the Bitcoin and Ethereum leaders.
When choosing between these contracts, consider your primary goal. For pure Bitcoin exposure with maximum liquidity, IBIT is the standard. For cost efficiency, MSBT offers a compelling alternative. Ethereum investors should weigh the brand recognition of BlackRock against Fidelity’s established financial services infrastructure.
On-chain signals for market direction
Traditional market indicators often lag behind the structural shifts in crypto, but on-chain metrics provide a real-time view of market health. In 2026, the integration of spot Bitcoin ETFs has fundamentally altered how these signals behave, creating a new dynamic between institutional accumulation and retail sentiment.
MVRV Z-Score and exchange reserves
The Market Value to Realized Value (MVRV) Z-Score remains a primary tool for identifying market tops and bottoms. It compares Bitcoin’s market capitalization to its realized capitalization, which represents the aggregate cost basis of all coins in circulation. When the Z-Score spikes, it indicates that prices are significantly higher than the average holder’s cost basis, often signaling a local top. Conversely, low scores suggest the market is undervalued.
However, the interpretation of MVRV has shifted with the arrival of ETFs. Institutions are absorbing the available exchange float, reducing the liquidity available for retail traders. This structural change means that price movements are driven less by speculative retail flows and more by institutional rebalancing. As a result, traditional on-chain extremes may be less pronounced, but the underlying trend of institutional absorption remains a strong bullish signal over the long term.
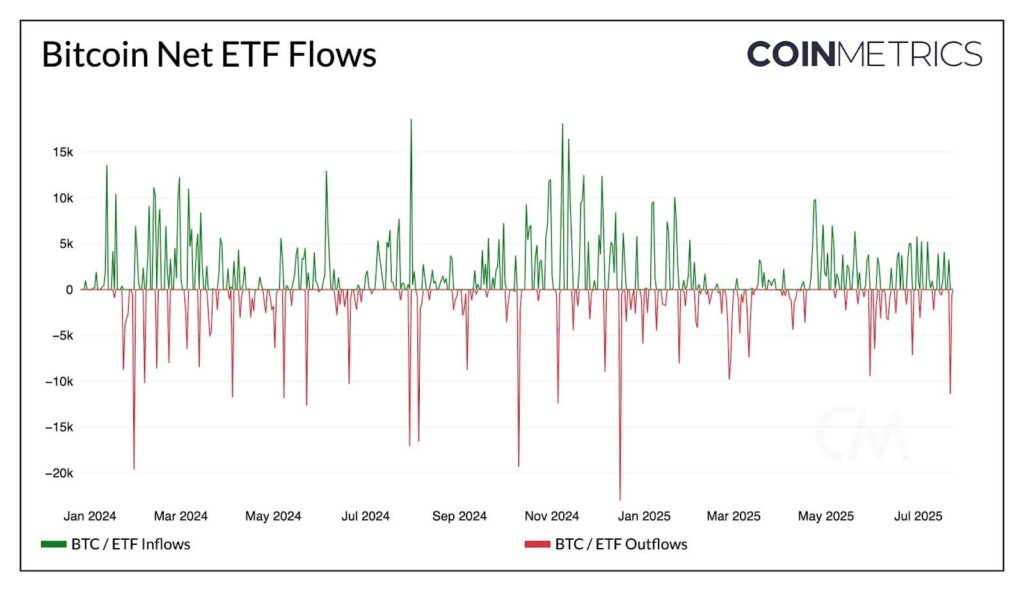
ETF flows and cycle changes
Spot Bitcoin ETF net flows now serve as a direct indicator of institutional demand. Large inflows often correlate with price stability and upward momentum, while sustained outflows can trigger market corrections. The interaction between ETF flows and on-chain metrics provides a more complete picture of market direction.
For instance, when ETF inflows are high but on-chain reserves are declining, it suggests that institutions are accumulating coins for long-term holding rather than short-term trading. This behavior reduces the circulating supply and can lead to price appreciation even during periods of low retail interest. Conversely, if ETF inflows stall while on-chain metrics show signs of overheating, it may signal a potential market downturn.
Technical analysis and price action
While on-chain metrics provide fundamental insights, technical analysis helps traders identify entry and exit points. The combination of on-chain data and technical indicators can improve the accuracy of market predictions.
TechnicalChart symbol="NASDAQ:GBTC" chartStyle="candle" interval="1D" indicators='["volume","rsi"]' />
Traders often look for divergences between price action and on-chain metrics. For example, if the price is making new highs but the MVRV Z-Score is declining, it may indicate weakening momentum and a potential reversal. Similarly, if ETF inflows are increasing while on-chain reserves are stable, it suggests growing institutional confidence and potential upside.
By monitoring these signals together, investors can gain a clearer understanding of market direction and make more informed decisions. The interplay between on-chain data, ETF flows, and technical analysis provides a robust framework for navigating the complex crypto market in 2026.
2026 ETF Tracking FAQ
What is the new crypto ETF for 2026? The top contracts for 2026 include BlackRock's IBIT for Bitcoin, Morgan Stanley's MSBT for low-cost exposure, BlackRock's ETHA and Fidelity's FETH for Ethereum, and Grayscale's GDLC for multi-asset diversification.
How do I track spot Bitcoin and Ethereum flows? Use provider-backed tools like Galaxy and Amberdata to monitor net inflows and outflows. These platforms update on-chain data in real time, helping you spot institutional accumulation or distribution before prices react.
What does a sustained ETF inflow signal? Consistent daily inflows often indicate institutional conviction. When combined with rising on-chain volumes, it suggests the asset is moving from speculative trading to long-term holding, which can stabilize price action.
Helpful gear
Use these product recommendations as a starting point, then choose the size, material, and price point that fit how you actually use the gear.
![The Crypto Millionaire Bible: [5 in 1] How to Easily Make Life-Changing Money in The Next Big 2025-2026 Bull Run with Smart Investing and Trading Any Cryptocurrency (Altcoins, Meme, NFT, Airdrops)](https://m.media-amazon.com/images/I/61K1jz+cWtL._AC_UY654_QL65_.jpg)

As an Amazon Associate, we may earn from qualifying purchases.

No comments yet. Be the first to share your thoughts!