
Why on-chain data matters for ETFs
Traditional market metrics like daily trading volume often lag behind the actual movement of institutional capital. In 2026, tracking crypto ETF on-chain data has become the primary indicator of institutional conviction. Unlike exchange volume, which can be inflated by high-frequency trading algorithms or wash trades, on-chain records provide an immutable ledger of where assets are actually moving.
This transparency is critical for understanding the true health of the market. By monitoring custodian wallet movements, investors can see real-time accumulation or distribution by major financial players. This visibility reveals whether large holders are positioning for long-term holds or preparing for quick exits.
On-chain data provides real-time visibility into custodian wallet movements, offering a clearer picture of institutional accumulation than daily volume alone.
The shift toward on-chain analysis also addresses trust deficits. As the industry matures, proving reserves has become as important as proving performance. Spot Bitcoin ETFs now must demonstrate they hold the Bitcoin they claim through crypto ETF Proof of Reserves (PoR). On-chain data allows the market to verify these claims instantly, ensuring that the assets backing the ETFs are real and accessible.
This level of scrutiny transforms passive ETF investing into an active, data-driven process. Investors are no longer relying solely on fund manager reports or quarterly disclosures. Instead, they can follow the money as it moves through the blockchain, gaining insight into the strategic decisions of the largest players in the financial system.
Track Bitcoin ETF inflows and outflows
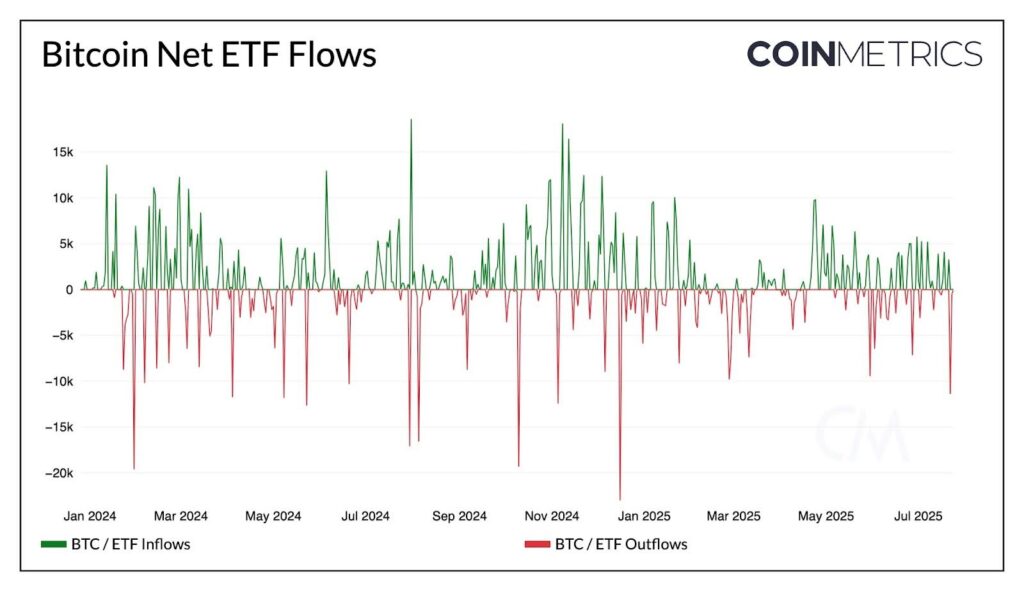
Monitoring spot Bitcoin ETF flows requires looking beyond simple price action. Institutional investors use on-chain metrics to gauge the health of the market and the conviction behind large capital movements. By tracking daily net inflows and outflows, you can identify whether institutions are accumulating or distributing their positions.
The primary data points to watch are the daily net flows for major issuers like BlackRock (IBIT) and Fidelity (FBTC). Positive inflows indicate new money entering the ecosystem, often signaling bullish sentiment, while outflows suggest profit-taking or a shift in strategy. These metrics are publicly available through financial data providers and can be visualized alongside Bitcoin's price to identify correlations.
To contextualize these flows, it is helpful to view them alongside Bitcoin's price action. A TechnicalChart widget allows you to overlay flow data with price movements, revealing patterns such as accumulation during dips or distribution during rallies. This combined view helps distinguish between short-term noise and long-term institutional trends.
For a comprehensive overview, you can monitor real-time data from sources like The Block or CoinMarketCap. These platforms provide daily updates on net flows, assets under management (AUM), and trading volumes for all major US spot Bitcoin ETFs. Focusing on these key metrics ensures you have a clear, data-driven perspective on institutional activity.
Ethereum ETF on-chain metrics
Tracking Ethereum spot ETFs requires looking beyond price charts. The real story lies in on-chain movements: how institutions enter, how much they hold, and whether the ETF trades at a premium or discount to its net asset value (NAV). These signals reveal institutional conviction long before it hits the broader market.
NAV deviations and premiums
The most immediate indicator of institutional demand is the premium or discount to NAV. When an Ethereum ETF trades above its net asset value, it signals strong buying pressure. A persistent premium suggests that institutional demand outstrips the daily supply of new shares. Conversely, a discount often reflects profit-taking or a lack of fresh capital. Unlike traditional funds, crypto ETFs can experience sharp intraday swings in these deviations due to the 24/7 nature of the underlying asset.
Custody movements and flows
On-chain data tracks the movement of ETH into and out of custodial wallets. Major custodians like Coinbase and BitGo publish daily reports on share creation and redemption requests. A surge in creation units indicates that authorized participants are assembling large blocks of ETH to back new ETF shares. This is a leading indicator of institutional accumulation. Conversely, redemption requests signal that large holders are exiting positions. Monitoring these flows provides a clearer picture of institutional intent than simple daily volume metrics.
Comparison of key metrics
The table below compares the on-chain and market metrics for the top Ethereum ETFs. This data highlights the disparity in custody size and trading activity, which directly impacts liquidity and NAV stability.
| ETF | AUM (Billions) | Avg NAV Deviation | Primary Custodian |
|---|---|---|---|
| BlackRock (ETHA) | 12.5 | +0.8% | Coinbase |
| Fidelity (FETH) | 4.2 | +0.5% | Coinbase |
| Grayscale (ETHE) | 1.8 | -2.1% | Coinbase |
| VanEck (HODL) | 0.9 | +0.3% | Coinbase |
Live market context
While on-chain data tells the story of institutional flow, the live price action reflects the market's immediate reaction to that data. The chart below shows the current price trend for Ethereum, providing context for the NAV deviations discussed above.
Spotting institutional accumulation patterns
Institutional accumulation rarely happens in a single, loud transaction. Instead, it manifests as a quiet but persistent shift in supply dynamics that retail traders often miss until the trend is already established. To identify these moves, you must look beyond simple price action and examine the flow of assets between exchanges and long-term custody solutions.
The primary signal of institutional buying is a net outflow of Bitcoin from exchanges. When large volumes move from hot wallets or exchange balances to cold storage addresses, it indicates a withdrawal for custody rather than preparation for a sale. This behavior reduces the liquid supply available on the open market, creating a supply shock that supports higher prices. Tools like Dune’s Bitcoin ETF dashboard allow you to track these custodian deposits and withdrawals in near real-time, providing a clear view of where the assets are actually sitting.
Another critical indicator is the deviation between the ETF’s net asset value (NAV) and its market price. While this is more common in equity markets, similar arbitrage mechanisms exist in crypto ETFs. When the ETF trades at a significant premium to its NAV, it often signals intense buying pressure from institutions who are willing to pay extra for immediate exposure. Conversely, a persistent discount can suggest institutional distribution or a lack of demand. Monitoring these spreads helps you gauge the intensity of institutional interest.
Finally, watch for consistent inflows over multiple days rather than isolated spikes. A single day of large inflows can be noise, driven by market makers or arbitrageurs. However, a sustained period of daily net inflows into spot Bitcoin ETFs is a strong confirmation of institutional accumulation. This pattern suggests that large players are systematically building positions, likely in anticipation of longer-term macroeconomic shifts or regulatory clarity.
-
Check for sustained exchange outflows to cold storage
-
Monitor ETF NAV premiums or discounts for buying pressure
-
Confirm daily net inflows over a multi-day period
-
Track custodian address activity on platforms like Dune
By combining on-chain custody data with ETF market metrics, you can build a more accurate picture of institutional sentiment. This approach removes the guesswork from market analysis and allows you to position yourself ahead of major trend shifts.

No comments yet. Be the first to share your thoughts!