
Why on-chain ETF data matters now
Traditional ETF reporting relies on end-of-day Net Asset Value (NAV) calculations, which update only once every 24 hours. This lag creates a blind spot for traders who need to understand real-time capital flows. In 2026, the market has shifted toward on-chain visibility, where every transaction is recorded on the blockchain as it happens. This transparency allows analysts to track inflows and outflows with precision, rather than waiting for delayed regulatory filings.
Spot Bitcoin ETFs now hold billions in on-chain assets, making real-time data critical for market analysis. Services like Coin Metrics’ ETF On-Chain Insights and Amber Data’s infrastructure provide the backbone for this visibility. They track not just the price, but the actual movement of tokens between custodians, exchanges, and ETF wallets. This level of detail reveals institutional behavior that daily reports simply cannot capture.
This shift from static reporting to live on-chain monitoring is essential for understanding market dynamics. It allows investors to see exactly when large entities are accumulating or distributing assets. Without this data, market participants are reacting to yesterday’s news. With it, they can anticipate trends and manage risk more effectively in a high-stakes environment.
Bitcoin ETF on-chain holdings and flows
Tracking the movement of spot Bitcoin ETFs requires looking past daily price action to the underlying on-chain data. This data provides a transparent view of how much Bitcoin is actually held in custody by major issuers and how capital is flowing between funds. Unlike traditional equity markets, where ownership records are centralized and opaque, Bitcoin ETF holdings are recorded on the public ledger, offering real-time visibility into institutional accumulation and distribution.
BlackRock’s iShares Bitcoin Trust (IBIT) and Fidelity’s Wise Origin Bitcoin Fund (FBTC) have emerged as the dominant custodians, collectively holding the majority of the Bitcoin supply allocated to these financial products. Grayscale’s GBTC, while still significant, has seen its relative share fluctuate as investors migrate toward lower-fee alternatives. Monitoring these specific wallets allows analysts to distinguish between long-term institutional conviction and short-term trading activity.
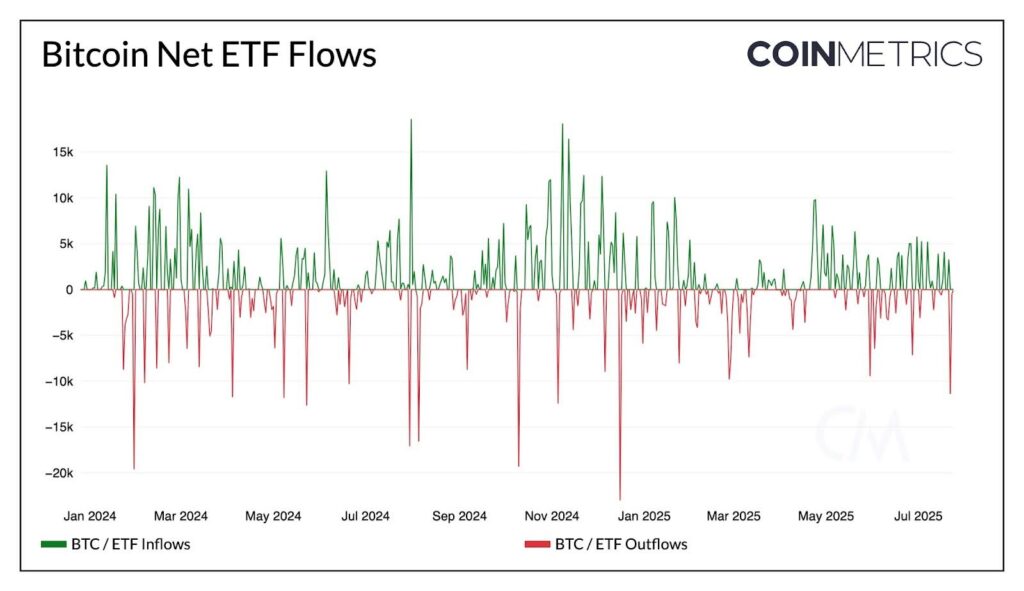
To visualize the correlation between price action and underlying accumulation, we can examine the on-chain holdings data for key issuers. The chart below illustrates the price and volume trends for IBIT, a primary proxy for institutional demand. When on-chain inflows increase while price remains stable, it often signals accumulation by large holders rather than retail speculation.
The total Bitcoin held in ETF custody serves as a critical metric for market health. As these funds continue to absorb Bitcoin from exchanges, the circulating supply on open markets decreases, potentially creating upward pressure on price if demand remains constant. Investors tracking these flows should pay close attention to net inflows and outflows reported by issuers, as these figures directly impact the on-chain supply dynamics.
Ethereum ETF on-chain metrics
Tracking Ethereum ETF flows requires a different lens than Bitcoin. While Bitcoin ETFs primarily track spot holdings, Ethereum’s dual nature as a store of value and a settlement layer introduces staking dynamics that complicate the on-chain picture. The visibility of ETH holdings is generally higher than Bitcoin’s, but the distribution of those holdings across custodians and staking contracts creates unique data noise.
Staking implications for ETF structure
Not all Ethereum ETFs participate in staking. Most US-listed spot Ethereum ETFs, such as those from BlackRock (ETHA) and Fidelity (FETH), currently do not stake their underlying ETH. This means the on-chain balance of these specific custodial wallets reflects pure spot exposure. However, funds like Grayscale’s ETHE have historically engaged in staking, meaning their on-chain presence includes both ETH and staking rewards (or liabilities). Investors must distinguish between the custodian’s cold storage wallets and any active staking validator keys to understand the true liquid supply.
Visibility of ETH holdings
Unlike Bitcoin, where large movements often signal institutional accumulation or distribution, Ethereum’s on-chain data is fragmented. A significant portion of ETH is locked in Layer 2 bridges, DeFi protocols, and staking contracts. When an ETF custodian receives ETH, it typically moves to a multi-signature cold wallet. Tracking these wallets via block explorers like Etherscan provides real-time confirmation of inflows and outflows. This transparency allows investors to verify ETF creation and redemption events before they appear in daily volume reports.
Live ETH Price Context
The valuation of these ETFs is directly tied to ETH’s market price. Use the widget below to monitor live pricing, which impacts the net asset value (NAV) calculations for all spot Ethereum ETFs.
Solana ETF tracking and emerging data
Solana ETFs represent the next frontier in crypto asset tracking, bringing a high-throughput, low-cost blockchain into the traditional regulated market. Unlike Bitcoin or Ethereum, which have established multi-year ETF histories, Solana products are newer, meaning their on-chain data profiles are still being defined by market participants and issuers. Tracking these flows requires looking at specific Solana-native metrics rather than relying solely on Bitcoin-centric models.
The primary on-chain data points for Solana ETFs mirror those of other crypto products but are measured against the Solana network’s distinct performance characteristics. Key indicators include net new wallet addresses linked to authorized participants (APs), token transfer volumes on the Solana blockchain, and staking participation rates. Because Solana’s validator set is smaller than Bitcoin’s, the concentration of ETF-held SOL can have a more immediate impact on network dynamics and staking yields.
To monitor these emerging flows, investors should rely on provider-backed charts that reflect real-time Solana price action alongside ETF-specific volume data. Static historical tables often fail to capture the rapid shifts in sentiment associated with newer crypto assets. The following widget displays the current Solana market data, which serves as a baseline for understanding the underlying asset’s volatility before it impacts ETF shares.
Tracking Solana ETFs also involves monitoring the broader "on-chain economy" ETFs, such as the VanEck Onchain Economy ETF. These products hold equities of companies involved in blockchain infrastructure rather than the token itself, creating a different data profile. Investors should distinguish between direct Solana ETFs and broader blockchain infrastructure funds when analyzing on-chain capital movements.
Comparing top crypto ETF products
Choosing the right crypto ETF requires weighing asset exposure against cost and data accessibility. While Bitcoin and Ethereum products dominate the market by assets under management, newer funds targeting blockchain infrastructure or specific on-chain ecosystems offer different risk profiles. The following comparison highlights three distinct approaches to crypto exposure.
Bitcoin and Ethereum Spot ETFs
These funds track the spot price of the underlying asset, offering direct correlation to Bitcoin and Ethereum price movements. They generally carry the lowest expense ratios among crypto products, typically ranging from 0.12% to 0.25%. Transparency is high, as holdings are publicly verified daily through on-chain data or custodian reports.
Blockchain Infrastructure ETFs
Funds like the iShares Blockchain and Tech ETF (BLCN) invest in companies developing blockchain technology rather than the tokens themselves. This approach provides diversification across the tech sector but introduces equity market risks unrelated to crypto price action. Expense ratios are higher, often exceeding 0.40%, reflecting active management and broader equity screening.
On-Chain Economy Funds
The VanEck Onchain Economy ETF (NODE) focuses on companies and instruments tied to the on-chain economy, including digital asset services and blockchain infrastructure. This niche strategy aims for capital appreciation through sector-specific growth. Data availability varies, as holdings are less standardized than spot ETFs, requiring deeper due diligence on underlying asset exposure.
| Product | Type | AUM (Est.) | Expense Ratio | On-Chain Data |
|---|---|---|---|---|
| Bitcoin Spot ETFs | Spot Crypto | $80B+ | 0.12-0.25% | High |
| Ethereum Spot ETFs | Spot Crypto | $15B+ | 0.12-0.25% | High |
| Blockchain Tech ETFs | Equity | $500M+ | 0.40-0.65% | Medium |
| Onchain Economy ETFs | Active Equity | $100M+ | 0.50-0.75% | Low |
The choice between these products depends on your investment thesis. Direct crypto exposure offers pure price correlation, while equity-based funds provide diversification but with higher fees and indirect risk. On-chain data remains most transparent for spot ETFs, making them easier to verify for compliance and audit purposes.

No comments yet. Be the first to share your thoughts!