Why on-chain data matters for ETFs
Spot crypto ETFs operate differently from traditional equity funds because they hold the actual underlying assets. When you buy a Bitcoin or Ethereum ETF, the fund custodian purchases real BTC or ETH and stores it in cold wallets. This structural difference creates a transparent audit trail that investors can verify directly on the blockchain, rather than relying solely on quarterly reports or third-party summaries.
Traditional equity ETFs hold stocks and bonds, which exist on centralized ledgers managed by clearinghouses. Verifying those holdings requires waiting for official filings. In contrast, every transaction involving a spot crypto ETF custodian—such as BlackRock’s IBIT or Fidelity’s FBTC—is recorded on a public ledger. This allows analysts to track inflows and outflows in near real-time.
Platforms like Dune and Coin Metrics aggregate this data into dashboards that identify custodian addresses. By monitoring these addresses, investors can see exactly how much Bitcoin is being moved into or out of ETF wallets. This visibility transforms passive investment data into an active, on-chain signal.
The result is a level of transparency previously unavailable to institutional products. Investors no longer need to guess whether a fund is accumulating or distributing assets; they can watch the blockchain verify the fund’s activity day by day. This direct link between market action and on-chain reality is the core advantage of spot crypto ETFs.
Bitcoin ETF custody and flow tracking
Tracking Bitcoin ETF flows requires identifying the specific blockchain addresses used by custodians like BitGo, Coinbase, and Fidelity. These entities hold the underlying Bitcoin on behalf of the ETF issuers. When an authorized participant creates or redeems ETF shares, the corresponding Bitcoin moves to or from these custodial wallets. Monitoring these addresses provides a near real-time view of institutional demand and supply pressure that isn't always reflected in the ETF's daily net asset value reports.
On-chain analytics platforms aggregate this data to show net inflows and outflows. Tools like Dune Analytics offer dashboards that track deposits and withdrawals from known custodian addresses. These dashboards allow investors to see which specific funds are accumulating or distributing Bitcoin. By correlating this on-chain activity with price action, traders can gauge the strength of institutional interest beyond simple price movements.
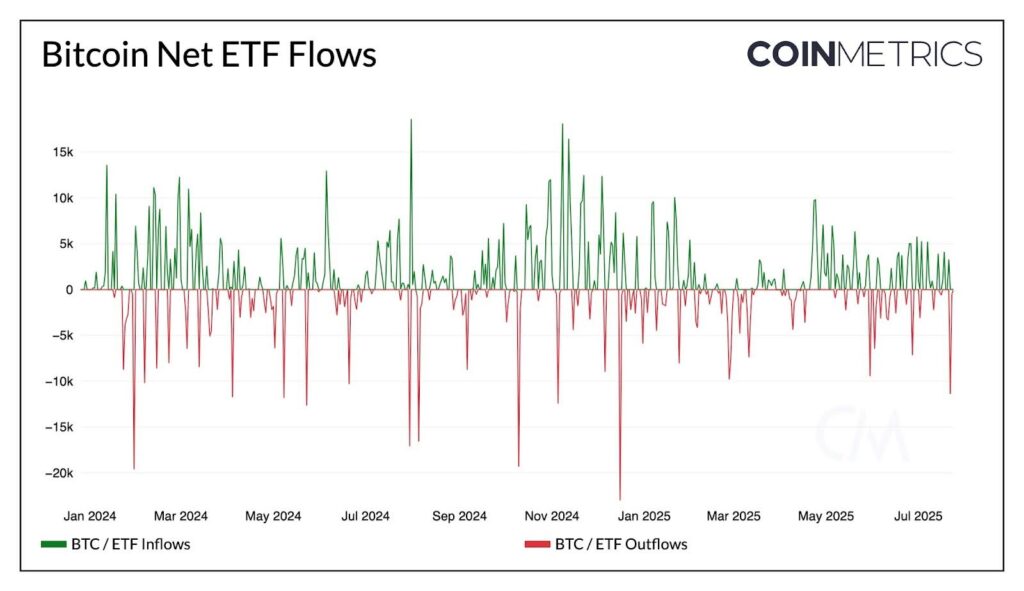
The following chart illustrates Bitcoin's price action alongside these flow metrics. Observing the correlation between custodian address balances and BTC price can reveal accumulation phases or distribution events before they become obvious in broader market trends.
Ethereum ETF supply dynamics
Tracking Ethereum ETFs requires looking beyond simple net inflows. Because Ethereum is a proof-of-stake network, the supply mechanics differ fundamentally from Bitcoin’s fixed cap. The real-time on-chain metrics for Ethereum ETFs focus on two distinct levers: the staking ratio of held assets and the net supply burn from transaction fees.
Staking ratios and custodial reports
A significant portion of Ethereum ETF shares are backed by ETH that is actively staked. Custodians like BlackRock and Fidelity report these holdings, but the on-chain data reveals the actual staking participation rate. When ETF providers stake the underlying ETH, they earn yield, which flows back to the fund. This creates a compounding effect that Bitcoin ETFs cannot replicate. Investors should monitor the percentage of ETF-held ETH that is staked versus resting in cold storage. A higher staking ratio generally indicates a more yield-positive structure, though it introduces validator-specific risks.
The burn mechanism and net supply
Ethereum’s EIP-1559 mechanism burns a portion of transaction fees, creating a deflationary pressure that varies with network usage. For ETF holders, this means the underlying asset supply can shrink over time, potentially increasing the scarcity of the remaining tokens. Unlike Bitcoin, where supply issuance is predictable and halving-based, Ethereum’s supply dynamics are tied directly to network activity. When on-chain demand is high, more ETH is burned, offsetting the issuance to validators.
Live data and provider-backed widgets
To track these dynamics accurately, rely on provider-backed tools rather than static price lists. Real-time data sources show how inflows correlate with staking yields and burn rates. The widget below provides the current market price, but the deeper insight comes from monitoring the on-chain supply changes alongside these flows.
Comparing top crypto ETF platforms
Choosing the right platform depends on whether you need raw custody data, high-level fund flows, or granular on-chain tracking. The market splits into three distinct layers: the ETF issuers themselves, the independent data aggregators, and the specialized on-chain analytics firms.
The issuers provide the most authoritative source for custody and daily holdings. BlackRock (IBIT), Fidelity (FBTC), and Grayscale (GBTC) publish official reports that verify the Bitcoin actually held in cold storage. These are the primary sources for verifying the "backing" of the ETF, but they lack real-time flow data.
For tracking daily inflows and outflows, independent data providers like The Block and ETF Database aggregate the net asset value (NAV) changes across all major issuers. These platforms offer a consolidated view of market sentiment, showing which funds are gaining or losing institutional interest in real time.
On-chain analytics firms like Dune and Coin Metrics bridge the gap between traditional finance and blockchain data. They track the specific wallet addresses associated with ETF custodians, allowing you to see deposits and withdrawals as they happen on the blockchain, rather than waiting for end-of-day reports.
The table below compares the three primary Bitcoin ETF issuers by their current market standing and cost structure.
| Issuer | Ticker | AUM (Approx.) | Annual Fee | Custodian |
|---|---|---|---|---|
| BlackRock | IBIT | $30B+ | 0.25% | Coinbase |
| Fidelity | FBTC | $15B+ | 0.25% | Coinbase |
| Grayscale | GBTC | $10B+ | 1.50% | Coinbase |
Spotting Whale Accumulation Signals
Large on-chain transfers often precede major price movements, but not every whale alert signals a trade. Distinguishing between institutional accumulation and routine operational transfers requires looking at the destination of the funds. When Bitcoin moves from cold storage to a custodian wallet linked to a spot ETF issuer, it usually indicates preparation for minting new shares—a bullish signal of institutional demand.
Conversely, transfers from an exchange custodian back to cold storage suggest that institutions are removing supply from the market to hold long-term. This "dry up" of liquid supply can reduce sell-side pressure, potentially supporting higher prices. Monitoring these flows helps separate noise from genuine accumulation patterns.
To track these movements accurately, use provider-backed tools that identify custodian addresses. Platforms like Dune offer dashboards that filter transactions by known ETF custodians, allowing you to see real-time deposits and withdrawals. Pairing this on-chain data with a price chart helps correlate large inflows with market reactions.

No comments yet. Be the first to share your thoughts!