Spot Bitcoin ETF inflows and outflows
Institutional capital is currently navigating a volatile landscape, with spot Bitcoin ETF flows serving as the primary indicator of professional market sentiment. Unlike retail speculation, these inflows and outflows reflect the strategic positioning of asset managers, pension funds, and family offices. Tracking these movements provides a clearer picture of long-term accumulation versus short-term hedging than price action alone.
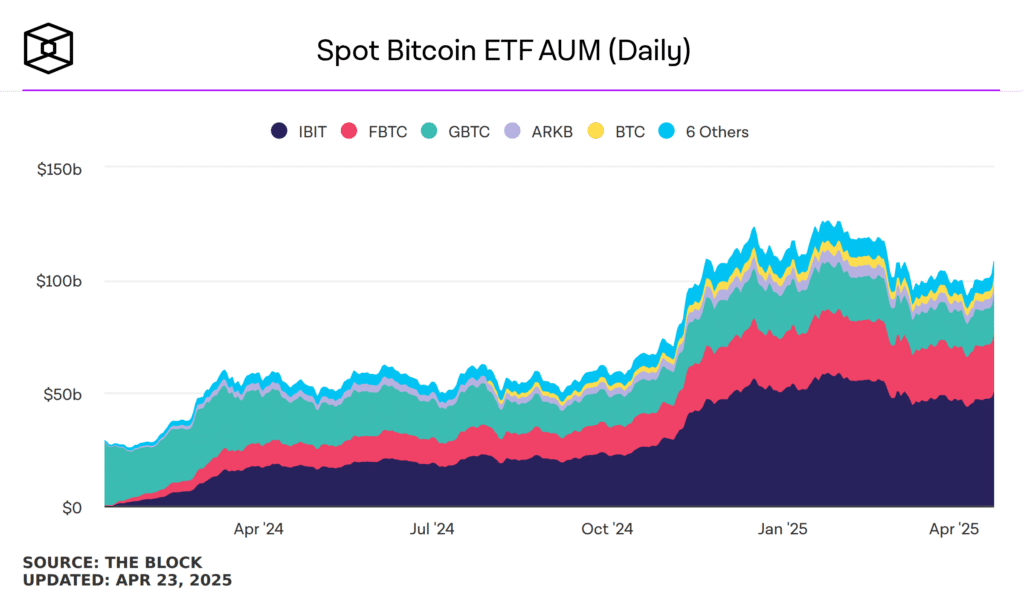
The iShares Bitcoin Trust (IBIT) and Fidelity Wise Origin Bitcoin Fund (FBTC) remain the dominant channels for this capital. Their daily net asset value (NAV) changes often correlate with macroeconomic data releases and regulatory developments. When inflows accelerate, it typically signals renewed confidence in Bitcoin as a digital store of value. Conversely, sustained outflows may indicate profit-taking or a shift toward alternative risk assets.
To visualize these trends, the chart below tracks the price and volume of one of the largest spot Bitcoin ETFs over the last 90 days. This view helps identify periods of institutional accumulation, where steady buying pressure supports price stability, versus distribution phases, where selling volume spikes often precede corrections.
Comparing top spot Bitcoin ETFs
Choosing the right spot Bitcoin ETF often comes down to two factors: cost and liquidity. While the underlying asset is identical across providers, fees and trading volume can significantly impact your returns, especially for active traders or those making regular contributions.
The following table compares the three largest spot Bitcoin ETFs by assets under management. These figures represent typical market conditions; always verify real-time data before executing trades.
| Ticker | Issuer | Expense Ratio | AUM (Approx.) | Avg. Daily Volume |
|---|---|---|---|---|
| IBIT | BlackRock | 0.25% | $30B+ | $2B+ |
| FBTC | Fidelity | 0.25% | $15B+ | $1B+ |
| GBTC | Grayscale | 1.50% | $10B+ | $500M+ |
IBIT (iShares Bitcoin Trust) leads the market in both assets and trading volume, offering tight bid-ask spreads that benefit high-frequency traders. FBTC (Fidelity Wise Origin Bitcoin Fund) is a close competitor, often preferred by investors who already use Fidelity’s brokerage platform for consolidated account management.
GBTC (Grayscale Bitcoin Trust) has historically carried a premium fee structure due to its legacy status as the first Bitcoin investment vehicle. While it remains a major player, its higher expense ratio makes it less attractive for long-term buy-and-hold strategies compared to the newer, lower-cost entrants.
On-chain metrics driving ETF demand
Institutional capital doesn't move in a vacuum. The flow of Bitcoin into spot ETFs is inextricably linked to the underlying on-chain health of the network. By monitoring exchange reserves and miner behavior, investors can gauge the structural supply pressure that often precedes or accompanies major ETF inflows.
Exchange reserves and supply shock
Bitcoin exchange reserves have hit multi-year lows as institutional custodians and ETF issuers pull coins off public exchanges. This reduction in liquid supply creates a sensitive market. When ETF inflows surge, the limited available Bitcoin on exchanges can lead to rapid price appreciation, as there are fewer coins to absorb the new demand. This dynamic is particularly visible when comparing daily inflow data against the trailing 30-day average of exchange balances.
The inverse correlation is clear: as ETFs accumulate Bitcoin, exchange reserves drop. This "supply shock" effect means that even modest ETF inflows can have an outsized impact on price stability and upward momentum. The market is essentially being starved of liquid supply while institutional demand grows.
Miner selling pressure
Miners play a critical role in this equation. After the 2024 halving, miner revenue dropped significantly, forcing many to sell Bitcoin to cover operational costs. However, as Bitcoin prices stabilized and ETF demand grew, miners have become more selective. A decrease in miner selling pressure, combined with steady ETF inflows, removes a major source of sell-side liquidity from the market.
Monitoring miner wallet activity helps distinguish between short-term profit-taking and long-term accumulation. When miners hold rather than sell, it signals confidence in the current price floor, reinforcing the bullish case driven by ETF adoption.
Technical context
The interplay between ETF flows and on-chain metrics is best viewed alongside price action. The following chart illustrates how Bitcoin's price has reacted to periods of high ETF inflow and low exchange reserves.
Callouts can help highlight these complex relationships without cluttering the narrative.
Blockchain and tech ETF alternatives
While spot Bitcoin ETFs offer direct exposure to the asset, investors seeking broader participation in the on-chain economy can look toward equity-based funds. These ETFs hold shares in companies involved in blockchain infrastructure, digital asset services, and crypto mining, providing diversified exposure beyond a single commodity. This approach allows investors to capture the growth of the underlying technology and the businesses building it, rather than relying solely on the price movement of Bitcoin itself.
The iShares Blockchain and Tech ETF (IBLC) is a prominent example of this category. It tracks an index of U.S. and non-U.S. companies involved in the development, innovation, and utilization of blockchain and crypto technologies. By investing in a basket of equities, IBLC offers a way to gain exposure to the sector while mitigating the volatility associated with holding the underlying digital assets directly. The fund includes companies ranging from major technology firms to specialized crypto service providers.
Investing in these equity ETFs simplifies access to the crypto ecosystem. Investors avoid the operational complexities of managing digital wallets, securing private keys, or navigating the technical hurdles of blockchain networks. Instead, they can buy and sell shares through standard brokerage accounts, just like any other stock. This ease of access makes blockchain exposure available to a wider range of investors who may be uncomfortable with the direct custody of digital assets.
It is important to distinguish between these equity funds and other on-chain focused products like the VanEck Onchain Economy ETF. While IBLC tracks a broad index of tech companies with blockchain ties, other funds may take an active management approach to invest specifically in companies meaningfully tied to the on-chain economy. Understanding the difference between passive index tracking and active management is key to selecting the right vehicle for your investment strategy. For most investors, the choice comes down to whether they want exposure to the broader tech sector's adoption of blockchain or a more concentrated bet on pure-play crypto businesses.
Tracking crypto ETF data sources
To monitor Bitcoin ETF flows accurately, you need to rely on official filings and primary aggregators rather than secondary news reports. The most reliable starting point is the Securities and Exchange Commission (SEC) EDGAR database, where issuers file daily Net Asset Value (NAV) reports. These filings provide the ground truth for inflows and outflows, ensuring you are tracking actual institutional activity rather than market speculation.
For a broader view of the blockchain asset class, ETF Database offers a comprehensive list of traded funds. This resource helps contextualize Bitcoin ETF performance against other blockchain-related instruments, such as the iShares Blockchain and Tech ETF or the VanEck Onchain Economy ETF. While these thematic funds differ from spot Bitcoin products, they often move in tandem during periods of high institutional interest.
On-chain data providers like Chainalysis also offer valuable insights into the underlying mechanics of these financial instruments. By tracking the movement of Bitcoin from cold storage to exchange wallets, you can verify whether reported ETF inflows are being held long-term or sold immediately. Combining SEC filings with on-chain analytics gives you a complete picture of where the money is actually going.

No comments yet. Be the first to share your thoughts!