Market structure shifts in 2026
The crypto market’s DNA changed in early 2026. The era of retail-driven volatility, defined by speculative frenzies and four-year halving cycles, is giving way to institutional, ETF-driven stability. This transition marks a fundamental shift in market structure, where price action is increasingly dictated by the steady inflows and outflows of regulated exchange-traded funds rather than the erratic behavior of individual traders.
As noted by Amberdata, Bitcoin’s traditional four-year cycle is effectively over. Institutional flows now serve as the primary anchor for price discovery, creating a more resilient but less explosive market environment. This structural change means that on-chain analysis is no longer just a tool for spotting whale movements; it is the critical lens through which we must view macro trends. Tracking ETF flows allows investors to distinguish between genuine institutional accumulation and temporary market noise.
The correlation between ETF inflow dates and broader price action has become the new market heartbeat. While retail sentiment still plays a role, the sheer volume of capital moving through these regulated products has dampened extreme volatility. For analysts, this means the focus must shift from chasing short-term momentum to monitoring the sustained flow of institutional capital.
Reading Bitcoin ETF Inflows on Chain
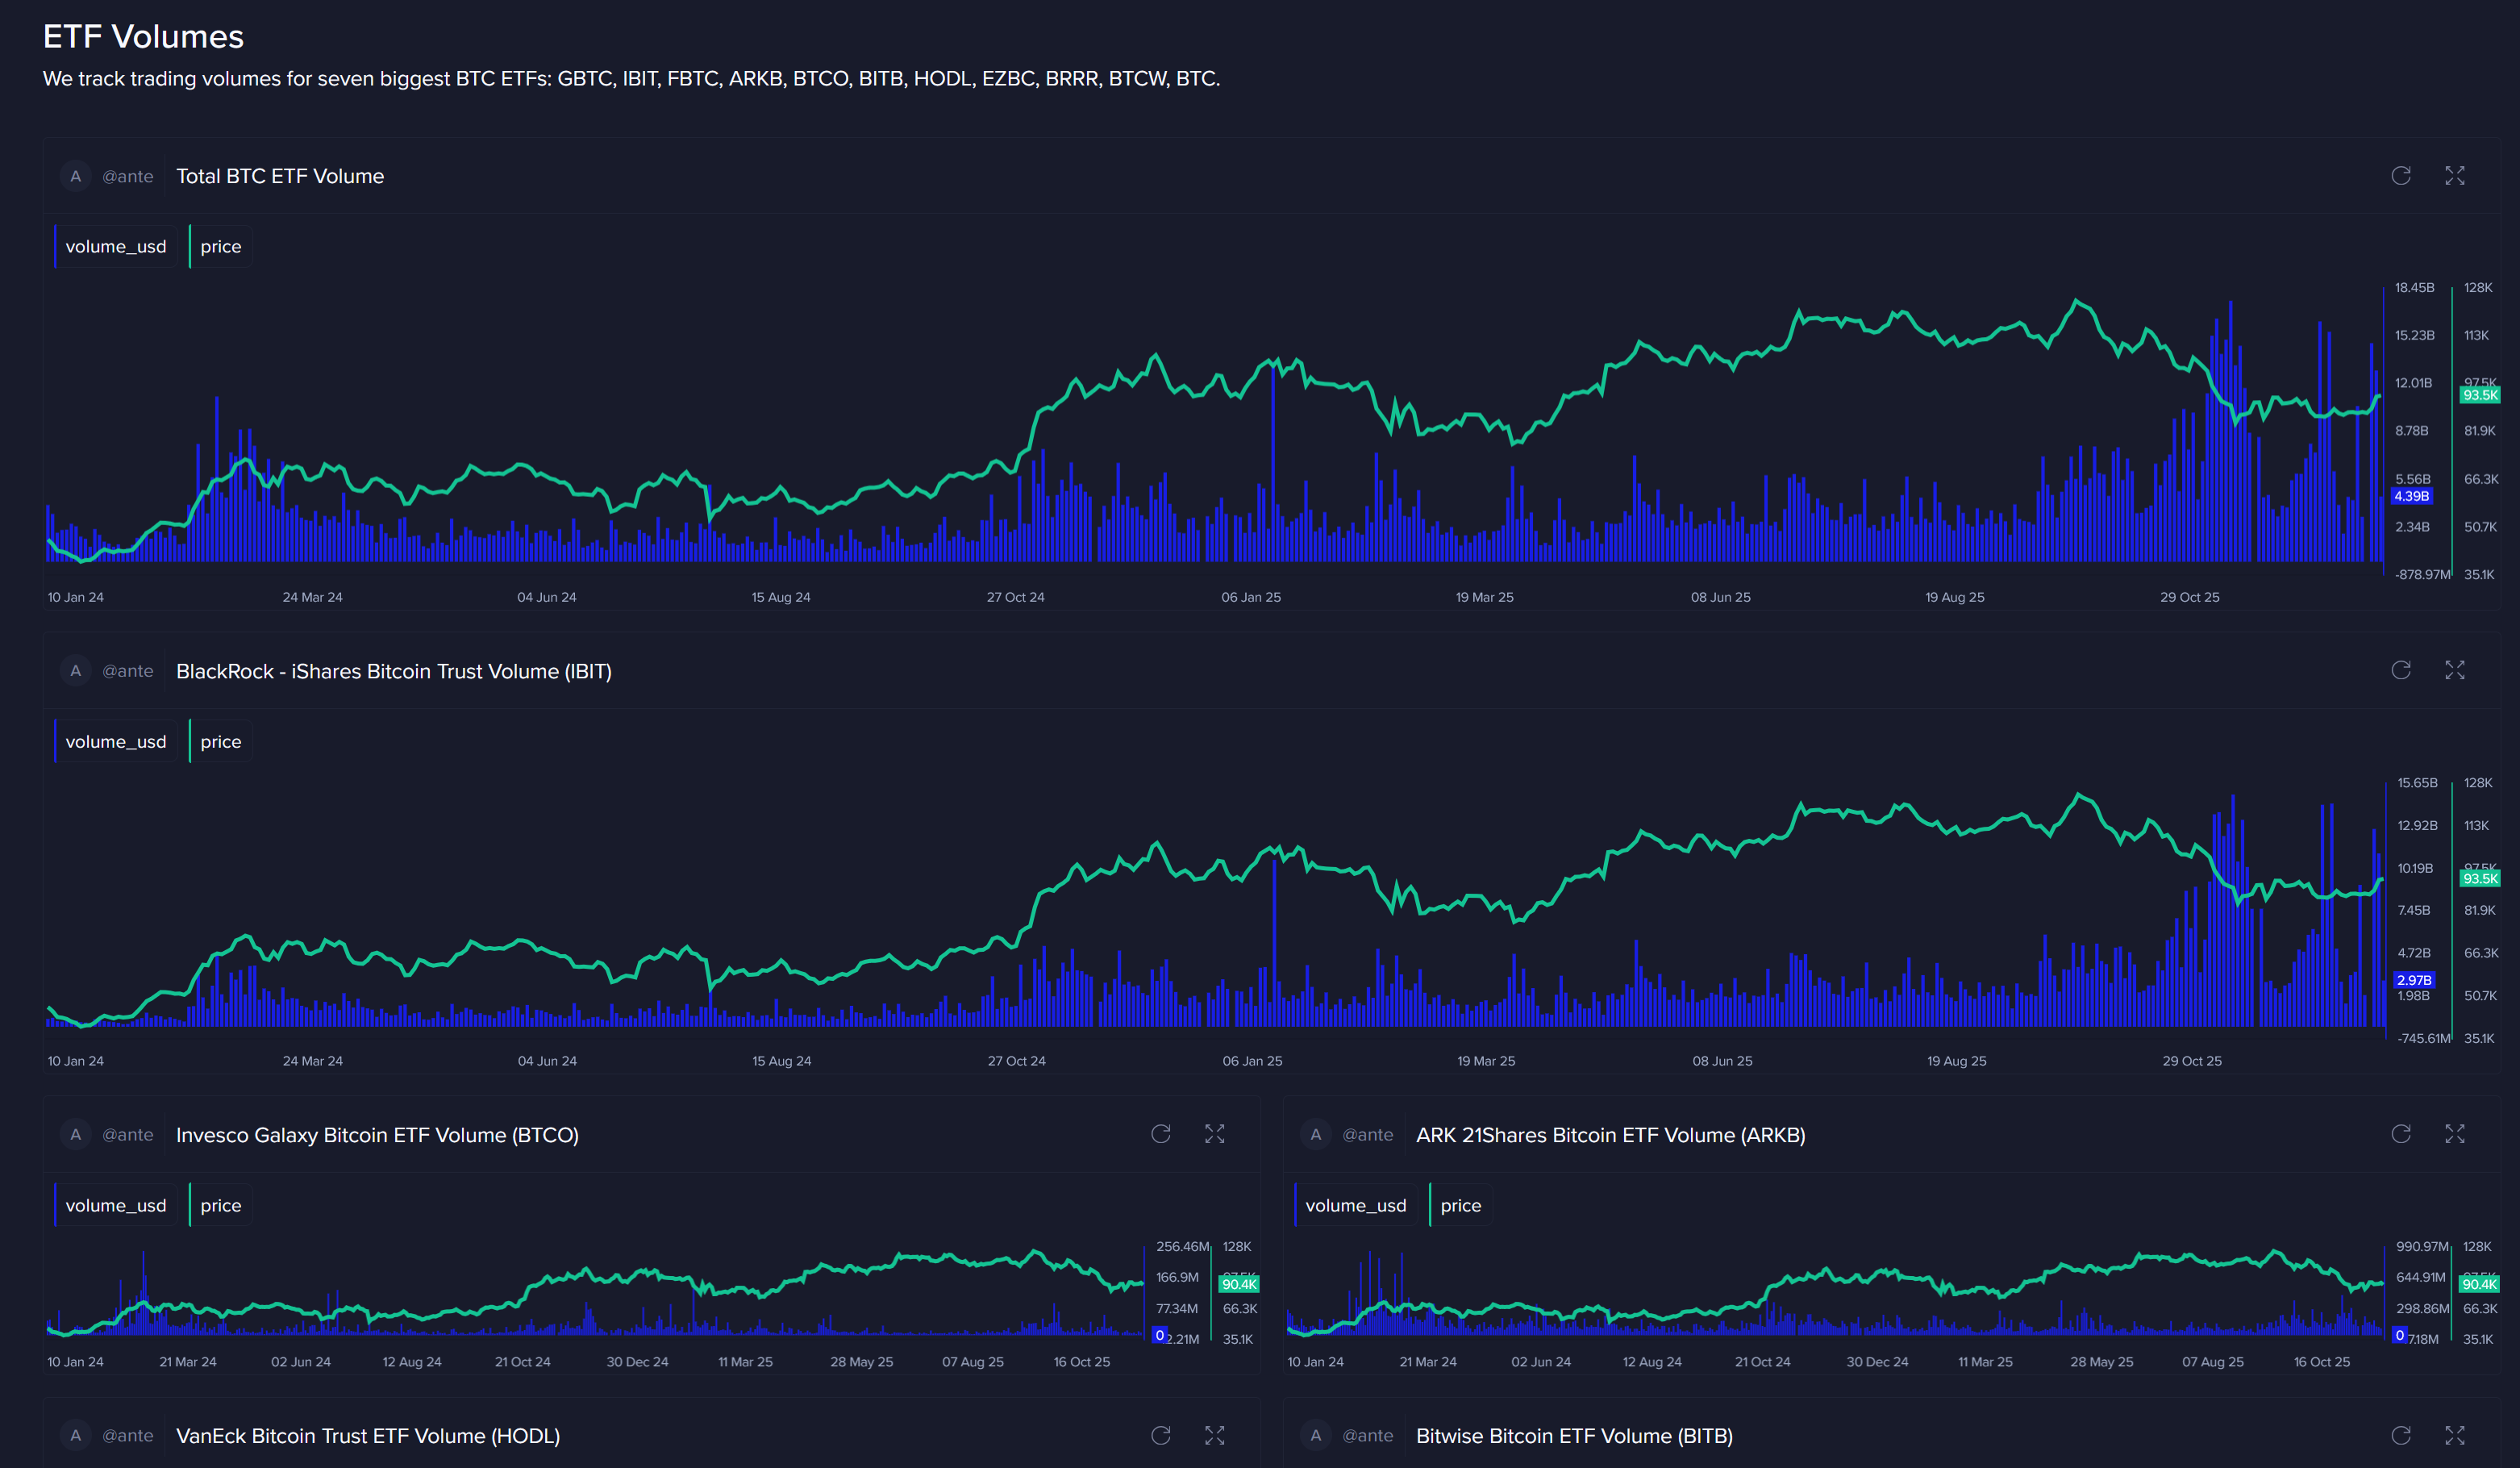
Bitcoin ETF net flows are the primary indicator of institutional demand, but they only tell part of the story. To understand where price pressure is actually coming from, you must look at on-chain data alongside these flows. The key distinction is between accumulation by long-term holders and depletion of exchange reserves. When ETF inflows coincide with falling exchange balances, it signals that new capital is moving directly into cold storage, reducing the immediate sell-side liquidity available on the market.
A surge in ETF inflows does not always mean the price will rise immediately. If the ETF issuers are selling older shares to new buyers (like the GBTC outflows seen previously), the net flow might be negative or flat, even if spot demand is steady. Conversely, positive inflows into issuers like IBIT or FBTC represent fresh capital entering the ecosystem. This fresh capital buys spot Bitcoin, which the custodian then moves off exchanges. This process shrinks the liquid supply, creating a supply shock that can amplify price moves when demand increases.
To track this effectively, compare the major ETF issuers and their custody structures. Not all ETFs handle their underlying Bitcoin in the same way, and their fee structures impact net returns for investors. The table below outlines the primary vehicles driving these flows.
The data shows that BlackRock’s IBIT dominates the inflow narrative, often accounting for the majority of daily net inflows. Fidelity follows as a strong second. Grayscale, while still a major holder, has shifted from a net outflow driver to a more stable holding as its high fee structure deters new speculative inflows. When analyzing on-chain metrics, focus on the net flow of IBIT and FBTC, as these are the primary engines of new spot demand. A sustained period of positive inflows into these two funds, coupled with declining exchange reserves, is a strong bullish signal for Bitcoin’s price trajectory in 2026.
Tracking Solana ETF Smart Money
Solana ETFs have emerged as a primary conduit for institutional capital, shifting the focus from retail speculation to structured accumulation. Tracking the flow of these assets requires monitoring the creation and redemption of ETF shares, which often precede significant on-chain movements. When authorized participants mint new shares to meet demand, the underlying SOL is typically transferred from cold storage to exchanges or staking protocols, signaling fresh institutional entry.
Conversely, redemptions often indicate profit-taking or risk reduction, pulling SOL out of circulation. By correlating ETF share counts with on-chain wallet activity, analysts can identify "smart money" positioning that retail traders might miss. This dual-layer analysis provides a clearer picture of long-term sentiment than price action alone.
The following chart highlights SOL-USD price action alongside volume spikes. These spikes frequently align with major ETF news cycles or large-scale on-chain transfers, offering a visual confirmation of institutional activity.

ETF NAV versus on-chain price
The price you see on a crypto exchange and the Net Asset Value (NAV) reported by an ETF issuer are two different metrics measuring the same underlying asset. Understanding the gap between them is essential for tracking institutional behavior. The on-chain price reflects real-time supply and demand on secondary markets, while the ETF NAV is a calculated value based on the fund's holdings, typically updated once per day.
When the ETF trades above its NAV, it is at a premium; when it trades below, it is at a discount. This spread acts as a signal for arbitrage opportunities. Authorized Participants (APs) step in to close these gaps by creating or redeeming ETF shares, effectively aligning the market price with the intrinsic value of the crypto assets held inside. Large, sustained premiums often suggest strong institutional buying pressure that outweighs immediate supply.
To visualize this relationship, we can look at the current market data for Bitcoin, which serves as the primary benchmark for crypto ETF performance.
Monitoring the difference between the ETF's closing NAV and the spot price of Bitcoin helps identify trends in institutional sentiment. While retail traders might react to minute-by-minute volatility, institutional flows tend to smooth out these discrepancies over time, making the premium/discount metric a reliable indicator of long-term confidence.
Institutional crypto flows dashboard
Monitoring institutional crypto flows requires focusing on on-chain signals that precede price action. An institutional flows dashboard acts as a radar for capital movement, filtering out retail noise to reveal where smart money is positioning itself.
Stablecoin Minting
New stablecoin supply often precedes spot buying. When major issuers mint large volumes of USDT or USDC, it indicates fresh capital is entering the ecosystem, ready to deploy into assets like Bitcoin or Ethereum ETFs.
Exchange Outflows
Large transfers from centralized exchanges to cold storage signal accumulation. When institutions move assets off-trading platforms, they are removing supply from the market, reducing sell-side pressure and often supporting higher valuations.
ETF Net Inflows
Tracking daily net inflows into spot ETFs provides a direct measure of institutional demand. Sustained positive flows confirm institutional conviction, while outflows may signal profit-taking or risk-off sentiment.
Checklist for ETF-Related Trades
-
Verify stablecoin minting volume is increasing
-
Check for large exchange outflows in the last 24 hours
-
Confirm ETF net inflows are positive for the week
-
Monitor on-chain whale activity for large wallet movements
-
Cross-reference technical chart signals with on-chain data

No comments yet. Be the first to share your thoughts!