How ETFs changed the on-chain cycle
The arrival of spot crypto ETFs has fundamentally altered the rhythm of Bitcoin markets. Where retail traders once drove volatility through speculative buying and selling during halving events, institutional capital now dictates the flow. This structural shift means the traditional four-year cycle, once defined by mining difficulty adjustments and retail FOMO, is being replaced by a model driven by continuous institutional accumulation and rebalancing.
For analysts tracking market health, this change is critical. The primary metric of market health has moved from mining difficulty to exchange reserves. As BlackRock’s IBIT and other major funds absorb Bitcoin from exchanges, the available float shrinks. This creates a supply shock that is more persistent than the post-halving scarcity that previously defined the market.
This transition is evident in the data. Institutional investors treat Bitcoin as a long-term reserve asset rather than a short-term trading vehicle. Consequently, they withdraw coins from exchanges to cold storage, reducing the liquidity available for price swings. While retail traders may still react to daily news, the underlying price structure is now anchored by these large, steady inflows.
Understanding this dynamic requires looking beyond simple price charts. The correlation between ETF net inflows and exchange reserve balances has become the new leading indicator. As institutions continue to dominate the market, on-chain analysis must focus on where these assets are moving, not just how many are being mined.
Spot Bitcoin ETF inflow tracking
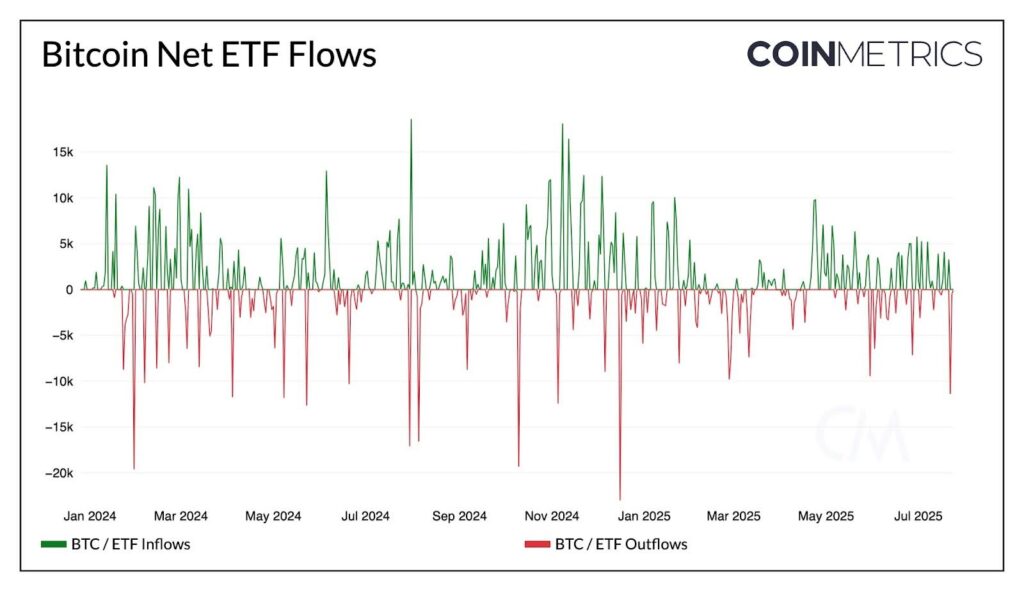
Tracking spot Bitcoin ETF inflows requires looking beyond headline price movements to see where institutional capital is actually settling. Spot Bitcoin ETFs have evolved from speculative novelty to core portfolio holdings, but the flow of assets reveals a shifting hierarchy among issuers.
The market is currently dominated by a few heavyweights, with BlackRock’s IBIT and Fidelity’s FBTC capturing the lion’s share of net inflows. While early 2026 saw weakened flows, recent data indicates a stabilization in demand as institutions adjust to the new regulatory landscape. Understanding these flows is essential for gauging genuine institutional conviction versus short-term trading activity.
The table below compares the top three spot Bitcoin ETFs by assets under management (AUM), daily volume, and net inflow trends. This snapshot highlights the disparity between the market leaders and smaller competitors.
| ETF | Issuer | AUM (Est.) | Avg Daily Volume | Inflow Trend |
|---|---|---|---|---|
| IBIT | BlackRock | $85B+ | $2.5B | Stable Growth |
| FBTC | Fidelity | $40B+ | $1.2B | Steady |
| ARKB | ARK Invest | $5B+ | $300M | Volatile |
For real-time price context, here is the current trading data for the two largest spot Bitcoin ETFs:
Tracking ETF Custodian Whale Movements
Interpreting custodian movements requires distinguishing between routine operational transfers and genuine institutional positioning. Custodians like Coinbase Prime and Fidelity Digital Assets manage the vast majority of Bitcoin and Ethereum ETF reserves, but their wallets are not static vaults. They function as high-throughput hubs, moving assets between cold storage, hot wallets, and exchanges for daily settlement, rebalancing, and liquidity management.
Not every large transfer signals a directional bet. A movement from a cold storage wallet to an exchange deposit often indicates preparation for ETF redemptions or daily creation unit settlements rather than an intent to sell on the open market. Conversely, transfers from exchanges back to custodian cold storage typically signal long-term holding or accumulation. The key is context: cross-reference these movements with daily ETF flow data from official filings. A large exchange deposit paired with a spike in redemption requests suggests institutional profit-taking or risk reduction. If the deposit is isolated, it is likely just operational housekeeping.
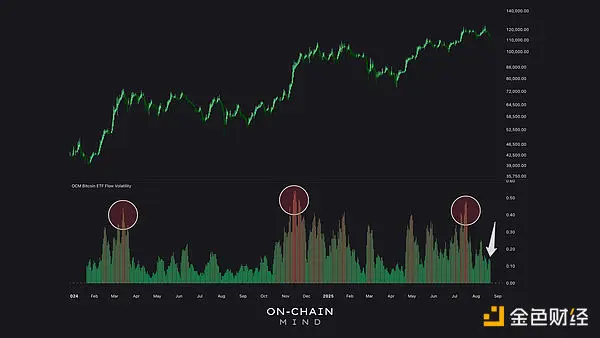
When analyzing whale alerts, focus on the destination and the timing relative to market volatility. Significant outflows from major custodians to private wallets during periods of high volatility often indicate institutional confidence and a desire to remove assets from exchange risk. These "smart money" moves can precede price stability or upward trends as exchange supply tightens. By filtering out the noise of routine custodian activity, you can identify the few large transfers that genuinely impact short-term liquidity and price discovery.
Solana and altcoin ETF on-chain metrics
Tracking spot ETF inflows for Solana and altcoin products reveals a market still in its early adoption phase. Unlike Bitcoin, which benefits from deep institutional liquidity, these newer vehicles show distinct on-chain behaviors that signal where institutional capital is tentatively flowing.
Ethereum ETFs have established a clearer on-chain footprint, with significant daily inflows recorded by issuers like BlackRock (ETHA) and Fidelity (FETH). The on-chain data for these assets shows higher transaction velocity compared to Bitcoin, reflecting a mix of retail speculation and institutional hedging. This liquidity depth is critical for understanding the current market structure, as it indicates that Ethereum is the primary altcoin proxy for traditional finance entering the space.
Solana ETFs, however, present a different on-chain narrative. With fewer authorized products currently trading, the on-chain data is sparse but highly sensitive to large transactions. Any significant movement in Solana ETF shares often correlates with broader altcoin market sentiment rather than pure institutional accumulation. Investors watching this space should monitor the difference between spot price action and ETF share volume, as divergence here often signals shifting risk appetite among non-retail participants.
The comparison between Bitcoin and these altcoin ETFs highlights a maturity gap. Bitcoin’s on-chain data is dominated by long-term holder accumulation and large institutional vaults. In contrast, Solana and Ethereum ETF data shows more short-term turnover. This suggests that while the institutional framework for altcoins is expanding, it is still evolving from speculative trading toward long-term holding.
Key on-chain metrics to watch in 2026
Tracking spot ETF inflows requires monitoring specific indicators that reveal institutional behavior. Unlike retail traders, institutions move large volumes, creating distinct footprints on the blockchain that signal accumulation or distribution phases.
The MVRV Z-Score measures the ratio of market value to realized value. When this metric spikes, it often indicates overvaluation, while low readings suggest the market is undervalued. Recent data suggests Bitcoin's cycle has structurally changed, with institutions absorbing the exchange float and dampening extreme volatility [src-serp-7].
Exchange Net Flow tracks the movement of assets between wallets and exchanges. Negative net flow indicates coins are leaving exchanges, a strong signal of long-term holding and accumulation. Conversely, positive net flow suggests coins are moving to exchanges, potentially signaling an intent to sell.
The Stablecoin Supply Ratio (SSR) compares the total supply of stablecoins to the market capitalization of crypto assets. A rising SSR means more buying power is sitting on the sidelines, often preceding price increases. A falling SSR suggests stablecoins are being converted into crypto assets.
These metrics work best when combined. For instance, negative exchange net flow paired with a low MVRV Z-Score provides a high-conviction signal of institutional accumulation. Monitoring these indicators helps clarify the impact of spot ETF inflows on market dynamics.

No comments yet. Be the first to share your thoughts!