
Reading the spot bitcoin ledger
Spot Bitcoin ETFs function as a bridge between traditional finance and the blockchain. Instead of relying solely on price movements or trading volume, on-chain data now tracks the actual Bitcoin held by these funds. Issuers purchase Bitcoin directly on cryptocurrency exchanges and store it in digital wallets managed by custodians. This creates a public ledger of institutional accumulation that is transparent and immutable.
This transparency allows investors to see exactly how much Bitcoin is being moved into or out of these funds. When an ETF issuer buys Bitcoin, it is recorded on-chain, providing a clear signal of institutional demand. Conversely, redemptions or sales are also visible, offering insight into potential selling pressure. This data provides a more granular view of market dynamics than price charts alone.
By monitoring these on-chain flows, analysts can gauge the sentiment of large-scale investors. Whale accumulation, for instance, often precedes significant price movements. Tracking these patterns helps distinguish between speculative trading and long-term holding strategies. The result is a deeper understanding of the forces driving the Bitcoin market.
Spotting institutional accumulation patterns
Tracking spot Bitcoin ETF flows requires distinguishing between passive holding and active trading behavior. On-chain data provides a clear window into this dynamic, revealing when large institutions are quietly accumulating supply versus when they are adjusting positions. By monitoring net inflows and outflows alongside custody status, you can identify whale accumulation trends that often precede broader market moves.
ETF data is better suited for identifying medium- to long-term capital trends rather than serving as short-term trading signals. Coin Metrics and other on-chain analytics providers now offer precise visibility into these flows, allowing investors to see exactly how much Bitcoin is being locked away by long-term holders versus what is circulating in the market. This distinction is critical for understanding the true demand side of the market.
To visualize these patterns, it helps to compare the key metrics of major spot Bitcoin ETFs. The table below outlines the issuer, typical daily volume characteristics, and the on-chain custody status for the largest players. This comparison highlights how different issuers handle the underlying assets, which can influence the liquidity and stability of the ETF share class.
| Issuer | Daily Volume Profile | On-Chain Custody Status |
|---|---|---|
| BlackRock (IBIT) | High | Custodian-held, off-chain |
| Fidelity (FBTC) | High | Custodian-held, off-chain |
| Grayscale (GBTC) | Variable (Declining) | Trust structure, legacy |
| Ark 21Shares (ARKB) | Moderate | Custodian-held, off-chain |
When analyzing these flows, look for consistent net inflows into issuers with strong institutional custody arrangements. A steady increase in holdings without a corresponding spike in secondary market volume often indicates that institutions are accumulating for long-term storage. Conversely, sudden outflows from major issuers can signal profit-taking or rebalancing by large funds. Use these on-chain insights to confirm whether price movements are backed by genuine accumulation or merely speculative trading.
How ETF Custodial Wallets Create Supply Shocks
Bitcoin spot ETFs do not just trade on exchanges; they fundamentally alter the available supply of Bitcoin through their custody mechanics. When an ETF issuer purchases Bitcoin, they transfer the asset from circulating exchange wallets to designated custodial wallets. These custodians, such as Coinbase Custody or BitGo, are authorized to hold assets for institutional clients but are generally restricted from trading on secondary markets. This process effectively removes the purchased Bitcoin from the open order books of major exchanges like Coinbase or Kraken.
The result is a supply shock that reduces immediate market liquidity. With fewer coins available for trading on exchanges, the market depth decreases. This means that even moderate buy or sell orders can cause larger price movements than they would in a deeper market. Tracking the movement of Bitcoin into these specific custodial addresses provides a clear signal of institutional accumulation. When these balances rise, it indicates that long-term holders are locking up supply, reducing the float available for speculation.
This dynamic is distinct from typical whale accumulation because it is driven by regulated financial products rather than individual entities. The flow of funds into ETF custodial wallets represents a structural shift in how Bitcoin is held. It transforms Bitcoin from a highly liquid, speculative asset into a more stable, long-term store of value. Monitoring these flows helps investors understand the underlying strength of demand beyond daily price action.
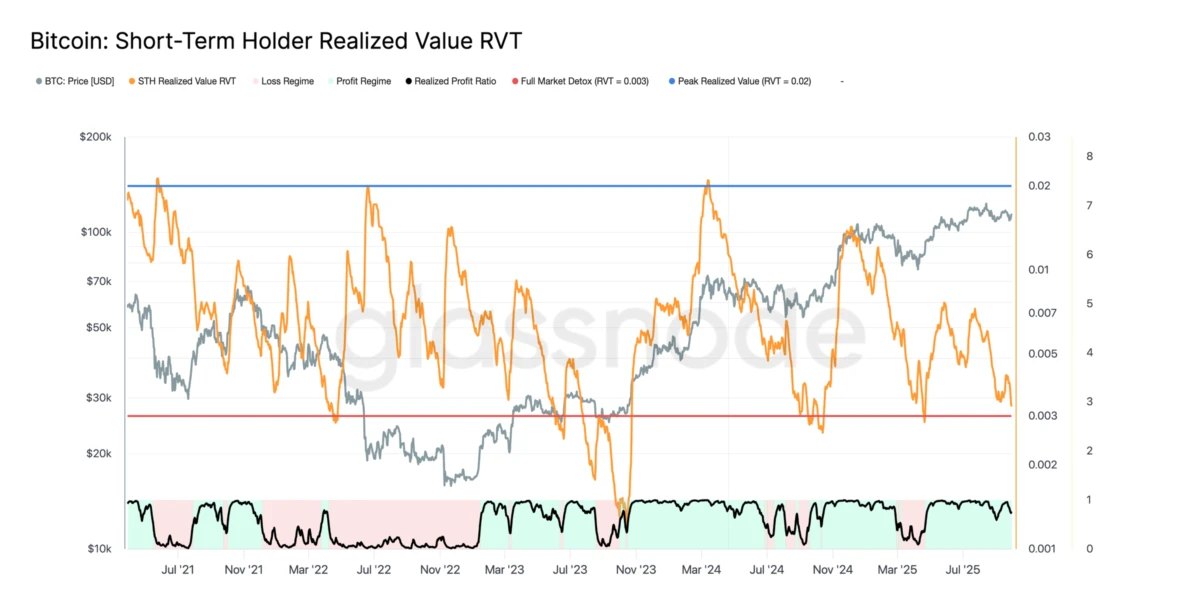
Understanding this mechanism allows investors to see past the noise of daily price fluctuations. By focusing on the movement of Bitcoin into and out of custodial wallets, one can gauge the true level of institutional interest. A sustained increase in custodial balances often precedes periods of price stability or growth, as the reduced supply absorbs market demand more efficiently.
Tools for tracking crypto ETF on-chain data
Tracking crypto ETF on-chain data requires moving beyond simple price charts to see where institutional capital is actually settling. While CoinMarketCap and CoinGlass provide accessible dashboards for net inflows and aggregate holdings, they often lag behind the granular visibility offered by specialized on-chain analytics firms. For serious analysis, you need platforms that track the specific blockchain addresses of the custodians and issuers, allowing you to distinguish between spot accumulation and secondary market trading activity.
Talos and Coin Metrics have emerged as leaders in this space, offering "ETF On-Chain Insights" that bridge the gap between traditional finance flows and blockchain settlement. These tools provide precise visibility into ETF inflows, outflows, and on-chain holdings, helping you analyze market dynamics with a level of detail that standard aggregators cannot match. By monitoring the movement of Bitcoin from exchange wallets to custodial addresses, you can identify when long-term holders are accumulating rather than distributing.
When evaluating these tools, prioritize those that offer real-time data feeds rather than end-of-day summaries. The distinction between short-term trading signals and medium-to-long-term capital trends is critical; on-chain data is best suited for identifying the latter. Use these platforms to confirm the strength of institutional demand, ensuring that price movements are backed by actual asset settlement on the blockchain.
Common questions about ETF on-chain metrics
Investors tracking institutional flows often need to clarify the underlying data sources and available investment vehicles. Understanding how on-chain metrics work and which ETFs exist for specific assets like Chainlink or broader blockchain technology helps frame the analysis of market movements.

No comments yet. Be the first to share your thoughts!