Why on-chain data matters for ETFs
Traditional volume metrics tell you how much trading happened, but they rarely reveal where the underlying assets actually went. For Bitcoin and Ethereum ETFs, the true story lies on the blockchain. Investors and issuers need to see the movement of coins between custodial cold storage and exchange hot wallets to understand real supply pressure.
ETF issuers like BlackRock and Fidelity publish daily custody reports, but on-chain data reveals the actual movement of assets between cold storage and exchanges.
This transparency shifts the advantage to those who can track real-time holdings. Platforms like Dune and Coin Metrics now allow users to monitor deposits and withdrawals from addresses identified as ETF custodians. By watching these flows, you can see if institutions are accumulating for long-term holding or preparing to sell into the market.
The result is a clearer picture of institutional intent. Instead of guessing based on price action, you can observe the physical transfer of digital assets that back the ETF shares.
Spotting institutional accumulation patterns
Tracking the movement of Bitcoin into spot ETF custodian wallets provides a clearer signal of institutional demand than price action alone. While retail traders react to daily volatility, institutions accumulate over longer horizons, often smoothing out market swings. By monitoring on-chain deposits to known custodian addresses, you can identify when large-scale buying is occurring before it fully reflects in the spot price.
Data platforms like The Block and Dune aggregate these flows, allowing you to correlate inflows with price stability. When significant capital enters custodial wallets during a period of price consolidation, it often indicates that institutions are absorbing sell pressure, building a floor for the asset. This pattern suggests that the market is being fortified by long-term holders rather than short-term speculators.
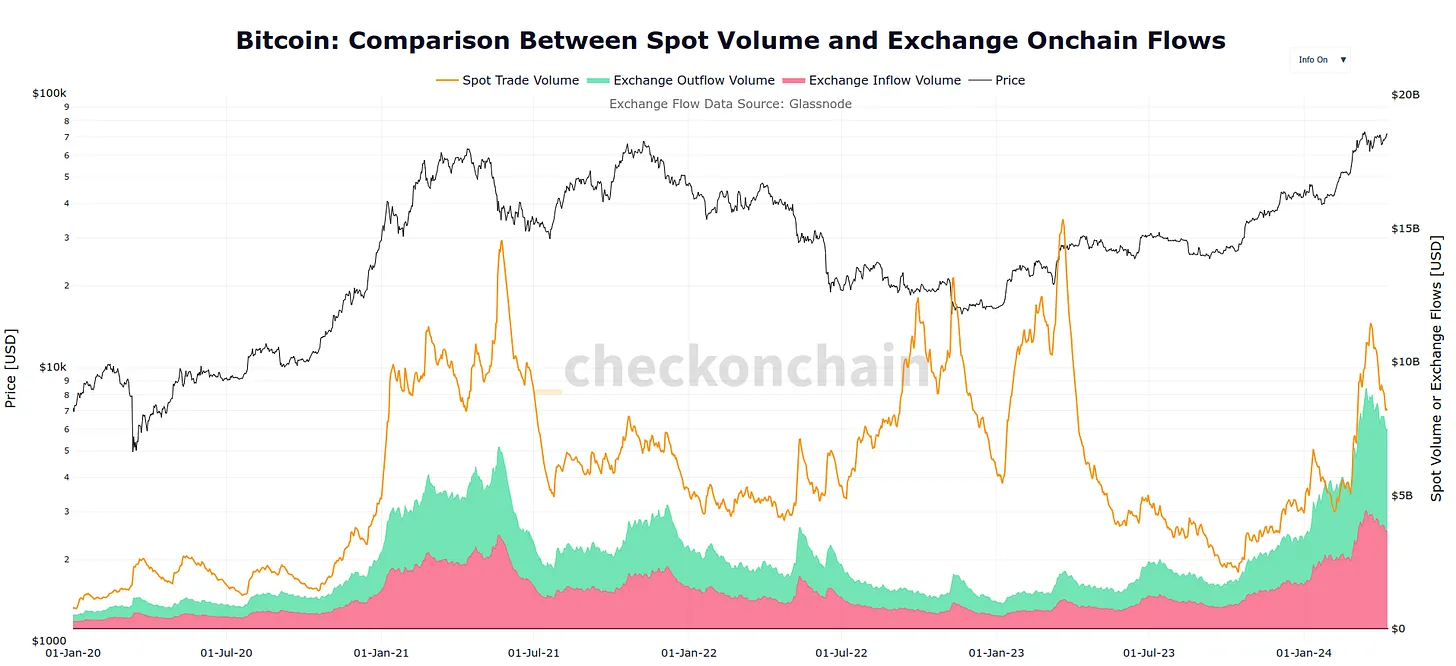
To verify these trends, it is helpful to view the price action alongside the volume data. The chart below for the iShares Bitcoin Trust (IBIT) illustrates how institutional inflows often coincide with sustained volume spikes, confirming the strength of the accumulation phase.
For those looking to set up a dedicated monitoring environment, the following tools can help streamline the process of tracking these on-chain metrics and managing your data feeds.


As an Amazon Associate, we may earn from qualifying purchases.
Whale Accumulation Trends in 2026
Tracking whale activity in the ETF space requires distinguishing between two distinct types of large holders: those creating new shares and those trading existing ones. The on-chain footprint of these groups differs significantly, revealing whether capital is entering the ecosystem or simply rotating within it.
Primary Market Creations
When institutional investors purchase directly from an ETF issuer, they deposit cash or underlying Bitcoin with the authorized participant (AP). This "primary market" activity increases the ETF’s total assets under management (AUM) and reduces the circulating supply of Bitcoin on exchanges. On-chain dashboards like Dune’s Bitcoin ETF tracker monitor custodian wallets to identify these large deposits, which signal fresh institutional demand rather than speculative trading.
Secondary Market Trading
Conversely, whales buying ETF shares on the secondary market (via stock exchanges) do not affect the underlying Bitcoin supply. These transactions represent a transfer of ownership between investors. While still bullish sentiment, secondary volume alone does not indicate new capital inflow. Analysts use this distinction to gauge whether price movements are driven by genuine accumulation or short-term liquidity shifts.
On-Chain Custodian Monitoring
Tools such as Coin Metrics’ ETF On-Chain Insights provide real-time visibility into these flows by tagging specific blockchain addresses linked to ETF custodians. By tracking deposits and withdrawals from these identified wallets, analysts can separate genuine accumulation from noise. This data is critical for understanding the true strength of institutional support behind Bitcoin’s price action in 2026.
Best blockchain analysis tools for ETFs
Tracking institutional flows requires more than a price feed. You need to see the underlying on-chain activity—custodian deposits, creation units, and supply movements. Three platforms dominate this space by offering granular data for Bitcoin ETFs: Dune, Coin Metrics, and The Block. Each serves a different analytical need, from community-driven dashboards to institutional-grade infrastructure.
Dune Analytics
Dune is the go-to platform for community-built, SQL-based dashboards. Its Bitcoin ETF dashboard tracks on-chain deposits and withdrawals for addresses identified as ETF custodians like Coinbase and Fidelity. The data is free to access, making it ideal for quick checks, though it relies on community-maintained queries that may lag behind official filings. Dune Bitcoin ETF Dashboard
Coin Metrics
Coin Metrics provides institutional-grade on-chain insights with a focus on precision. Their ETF module tracks real-time flows and supply with high fidelity, catering to professional traders who need reliable, audited data. This platform is built for depth and accuracy, offering a robust infrastructure for monitoring the granular mechanics of ETF creation and redemption.
The Block
The Block offers a comprehensive view of the ETF landscape, aggregating daily flows, assets under management (AUM), and volumes for major spot Bitcoin ETFs like IBIT, FBTC, and GBTC. It combines on-chain data with market metrics, providing a holistic view of institutional activity. Their data is widely cited in industry reports for its clarity and breadth. The Block Bitcoin ETF Data
Platform Comparison
| Platform | Data Granularity | Cost | Update Frequency |
|---|---|---|---|
| Dune | Custodian addresses | Free | Near real-time |
| Coin Metrics | Institutional grade | Paid | Real-time |
| The Block | Flows, AUM, Volume | Paid | Daily/Real-time |
Reading daily net flow data
Net inflows and outflows serve as the primary pulse for Bitcoin ETF market sentiment. When an ETF records a net inflow, new capital is entering the fund. This typically happens when investors buy ETF shares, prompting the fund to purchase underlying Bitcoin on the open market. This buying pressure adds to the available supply, often supporting or driving up the asset's price.
Conversely, net outflows indicate capital leaving the fund. Investors are selling their ETF shares, which forces the fund to sell Bitcoin to meet redemption requests. This selling pressure can suppress prices, especially if outflows are sustained over several days. Tracking these daily changes helps distinguish between short-term noise and genuine shifts in institutional appetite.
For context on the current asset price, which often correlates with flow direction, see the live chart below:
Sources like The Block and Dune provide real-time dashboards for these flows, allowing you to monitor specific funds like BlackRock (IBIT) or Fidelity (FBTC). Consistent inflows suggest institutional confidence, while erratic outflows may signal profit-taking or risk aversion.
Frequently asked questions about ETF data
Is there an ETF for blockchain?
Yes. The iShares Blockchain and Tech ETF (IBlock) seeks to track an index of companies involved in the development and utilization of blockchain technologies, including both U.S. and non-U.S. firms. Unlike spot crypto ETFs that hold the asset directly, this fund provides indirect exposure to the broader industry infrastructure.
Where can I track Bitcoin ETF flows?
Several platforms provide real-time on-chain data for Bitcoin ETFs. The Block and Dune Analytics offer dashboards that track deposits and withdrawals from identified custodian addresses. Coin Metrics also provides insights into supply movements, allowing investors to monitor institutional activity with precision.
How do I compare different crypto ETFs?
Investors can compare assets using metrics like Assets Under Management (AUM), daily trading volume, and net inflows. ETF Database and CoinMarketCap maintain comprehensive lists of available funds, including leveraged and inverse products from issuers like ProShares. These tools help evaluate liquidity and market sentiment across the sector.

No comments yet. Be the first to share your thoughts!