Why on-chain data matters for ETF flows
Traditional ETF reporting relies on end-of-day Net Asset Value (NAV) calculations. This creates a blind spot for traders and analysts who need to understand institutional positioning in real time. By the time a daily report is published, the market has already moved, and the nuance of large-scale accumulation or distribution is lost.
On-chain data removes this lag. Because Bitcoin ETFs must settle their creations and redemptions through custodians like Coinbase and Fidelity, every transaction leaves a permanent, public record on the blockchain. This visibility allows observers to track the actual movement of underlying Bitcoin assets rather than just the secondary market price of the ETF shares.
This distinction is critical for understanding market dynamics. As noted by industry analysts, the ability to monitor real-time on-chain ETF activity is becoming essential for interpreting price action and volatility 1. While traditional finance looks backward, on-chain data looks forward, revealing the true flow of capital into and out of the spot Bitcoin market.
Key metrics for tracking institutional flows
Spot Bitcoin ETFs have transformed from passive investment vehicles into active participants in the Bitcoin network. To track institutional flows accurately, you must look beyond daily net inflow numbers reported by issuers. Instead, monitor on-chain signals that reveal when custodians are moving coins to exchanges for sale or holding them in cold storage for accumulation.
Exchange deposits and withdrawals
The most direct signal of selling pressure is an increase in Bitcoin deposits to centralized exchanges. When ETF custodians like Fidelity or BlackRock deposit BTC into exchange wallets, it often precedes a sale to meet redemption requests. Conversely, large withdrawals from exchanges to cold storage wallets indicate accumulation and reduced selling pressure.
Tracking these movements requires data from platforms like Dune Analytics, which aggregates on-chain data for addresses identified as ETF custodians. A spike in exchange deposits without corresponding price increases can signal impending downward pressure, while sustained withdrawals suggest long-term holding strategies by institutions.
Supply concentration and holder distribution
Monitor the distribution of Bitcoin among large holders, often referred to as "whales." An increase in the percentage of supply held by addresses with over 1,000 BTC can indicate institutional accumulation. Conversely, if this concentration decreases as coins move into smaller wallets, it may suggest distribution or retail selling.
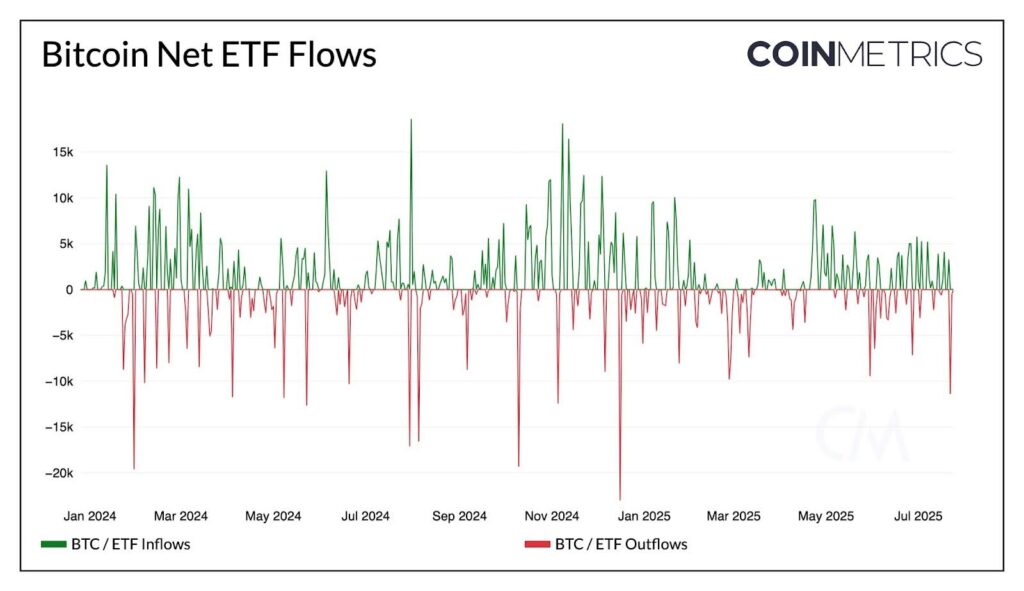
Price correlation with flow data
Understanding these metrics is most effective when correlated with price action. Use the chart below to visualize how Bitcoin's price responds to changes in ETF-related on-chain flows.
Top tools for real-time ETF monitoring
Tracking Bitcoin ETF flows requires more than just watching the price. To understand where institutional money is moving, you need structured on-chain data that distinguishes between custodian deposits, authorized participant creations, and redemptions. Three platforms currently dominate this intelligence layer: The Block, Coin Metrics, and Dune Analytics.
The Block offers a centralized dashboard that aggregates both spot and futures ETF data. It is designed for speed and clarity, allowing traders to compare fund flows and performance metrics in a single view. This makes it ideal for quick checks when market volatility spikes. The platform provides approval status updates alongside real-time flow data, serving as a reliable baseline for daily monitoring.
Coin Metrics provides a deeper on-chain perspective, focusing on the precise movement of assets into and out of custodial wallets. Their ETF On-Chain Insights tool tracks the net supply changes with high granularity, helping analysts separate actual investor demand from market maker hedging. This level of detail is essential for understanding the underlying strength of ETF inflows beyond simple daily totals.
Dune Analytics takes a community-driven approach, offering customizable dashboards built by independent data engineers. One of the most popular dashboards tracks on-chain deposits and withdrawals of addresses identified as custodians for major Bitcoin ETFs. This method provides a transparent, verifiable look at custody movements, though it requires users to interpret raw SQL-based data rather than relying on a polished, pre-packaged interface.
Comparison of ETF Data Providers
Choosing the right tool depends on whether you prioritize ease of use, on-chain precision, or customizable analysis. The table below compares the primary features of these leading platforms.
| Provider | Data Type | Latency | Cost | Best For |
|---|---|---|---|---|
| The Block | Aggregated Flows | Near Real-Time | Freemium | Quick market checks |
| Coin Metrics | On-Chain Custody | Block-Level | Subscription | Institutional precision |
| Dune Analytics | Custom Dashboards | Block-Level | Freemium | Deep DIY analysis |
The Block remains the go-to for traders who need a snapshot of the market without digging into the blockchain. Coin Metrics is the preferred choice for analysts who need to verify the source of supply changes at the custodian level. Dune Analytics serves those who want to build their own queries or explore specific custodian addresses in detail. Using a combination of these tools provides the most complete picture of Bitcoin ETF activity.
How ETF NAV and Supply Interact
Bitcoin ETFs trade on public exchanges, but their underlying value is anchored to the spot price of Bitcoin. This creates a daily calculation of Net Asset Value (NAV), which represents the actual worth of the ETF’s holdings. While the market price fluctuates by the second based on trader sentiment, the NAV is calculated once per day by the fund provider.
When the ETF’s market price exceeds its NAV, the fund trades at a premium. Conversely, if the market price drops below the NAV, it trades at a discount. These discrepancies are not just accounting errors; they signal arbitrage opportunities for authorized participants (APs). APs buy Bitcoin on the open market and exchange it for ETF shares when the fund is undervalued, or sell shares to redeem Bitcoin when the fund is overvalued. This mechanical process keeps the ETF price tightly coupled to the spot asset.
Tracking on-chain supply data alongside these NAV metrics reveals deeper accumulation patterns. When large amounts of Bitcoin are moved from exchanges to cold storage, supply is effectively removed from the market. If this supply squeeze coincides with sustained ETF inflows, it suggests strong institutional demand absorbing available liquidity. Conversely, if ETF outflows occur while on-chain supply remains static, it may indicate profit-taking without a corresponding drop in spot demand. Monitoring this interplay helps distinguish between genuine accumulation phases and temporary market noise.

No comments yet. Be the first to share your thoughts!