
Crypto etf on-chain data limits to account for
Tracking smart money flows into spot Bitcoin and Ethereum funds requires navigating a gap between public ETF disclosures and private blockchain visibility. While on-chain analysis offers real-time insight into wallet movements, ETFs operate through regulated custodians, creating a structural blind spot that complicates direct tracking.
The primary constraint is that ETF shares are held by authorized participants and custodial wallets, not retail addresses. When large inflows occur, the underlying Bitcoin or Ethereum moves from exchange cold storage to custodial vaults like Coinbase Custody or Fidelity Digital Assets. This transfer is visible on-chain, but it does not immediately confirm a purchase by a specific institutional investor. The on-chain signal is a proxy, not a direct ledger of ownership.
Also, net flow data reported by issuers like BlackRock (IBIT) or Fidelity (FBTC) is aggregated daily. This lag means that intraday on-chain spikes in exchange outflows may reflect broader market selling pressure rather than ETF-specific buying. Distinguishing between ETF accumulation and general spot market rotation requires cross-referencing custodial wallet movements with daily net flow reports.
To mitigate these constraints, analysts focus on two key indicators. First, monitor the "exchange net flow" metric; sustained outflows from major exchanges often precede ETF inflow announcements. Second, track the balance of known custodial addresses. A steady increase in these balances, coupled with positive net flows, provides the strongest confirmation of smart money entering the spot ETF space.
| Metric | Source | Frequency | Limitation |
|---|---|---|---|
| Custodial Wallet Balance | On-chain explorers | Real-time | Cannot distinguish between ETF holdings and other institutional custody |
| Net Inflows | Issuer reports (SEC 8-K) | Daily | Lagged by 24-48 hours; does not show intraday activity |
| Exchange Outflows | On-chain analytics | Real-time | Aggregated across all users; not specific to ETF purchases |
Crypto etf on-chain data choices that change the plan
Spot Bitcoin and Ethereum ETFs have shifted from pure price speculation to a market where on-chain flows reveal the underlying distribution of capital. Tracking these flows is essential for understanding smart money movements, but each data source offers different tradeoffs between speed, depth, and cost. Relying on a single metric can distort your view of market sentiment.
The primary tension lies between real-time transactional data and aggregated fund flows. Real-time on-chain data shows immediate wallet movements, including exchanges and custodians, but it often lacks the context of institutional intent. Conversely, aggregated ETF flow data, reported daily by issuers, provides a clearer picture of net institutional demand but arrives with a delay. Combining both layers allows you to distinguish between short-term trading noise and long-term accumulation.
Speed versus Accuracy
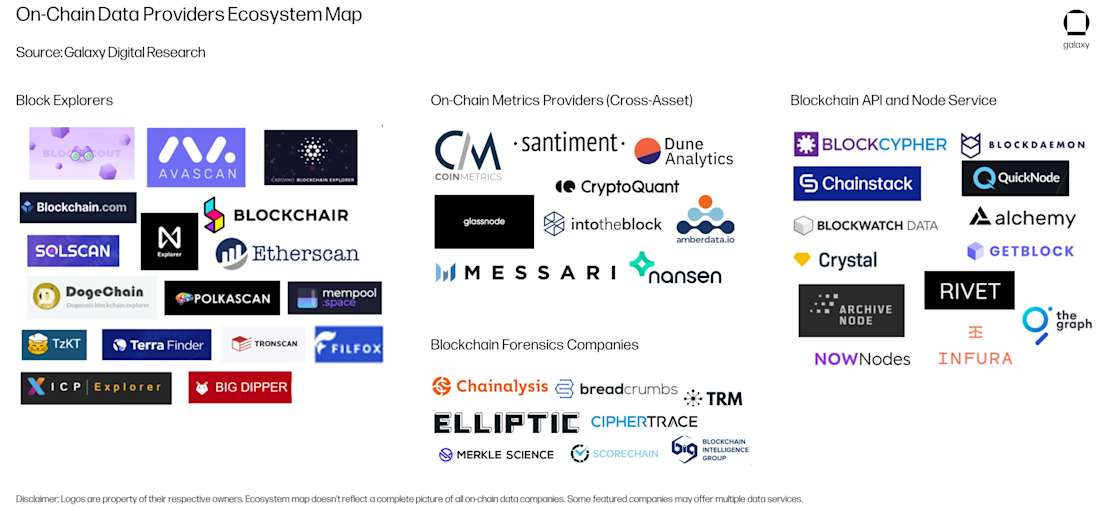
Real-time on-chain trackers like Glassnode or CryptoQuant update every block, offering immediate visibility into large wallet transfers. This speed is valuable for spotting sudden liquidity shifts or exchange inflows that may signal impending selling pressure. However, this data can be noisy. Large transfers between cold storage and hot wallets are often internal custodial operations, not market trades. Misinterpreting these as selling pressure can lead to premature exits.
Cost versus Depth
Institutional-grade on-chain analytics require expensive subscriptions but provide deep historical context and entity clustering. These tools can identify specific funds or family offices, offering a clearer picture of "smart money" behavior. Retail-accessible data is cheaper but often limited to aggregate metrics. For most traders, the tradeoff is acceptable if they focus on high-impact signals like exchange net flows rather than trying to track every individual wallet.
The Role of Aggregated Flow Data
ETF flow data, reported by issuers like BlackRock and Fidelity, offers a clean, audited view of net inflows and outflows. This data is less granular than on-chain data but is far more reliable for assessing institutional demand. When on-chain data shows exchange outflows and ETF flows are positive, it confirms a strong accumulation phase. When they diverge, it often signals profit-taking or redistribution.
| Metric | Speed | Depth | Cost | Best Use Case |
|---|---|---|---|---|
| Real-Time On-Chain | Instant | High | High | Spotting immediate liquidity shifts |
| Aggregated ETF Flows | Daily | Medium | Low | Tracking institutional demand |
| Exchange Net Flows | Near-Real-Time | Medium | Medium | Identifying sell-side pressure |
| Wallet Clustering | Delayed | Very High | Very High | Mapping smart money entities |
The best approach is to layer these data points. Start with ETF flows to establish the baseline institutional trend. Then, use real-time on-chain data to time your entries or exits based on immediate liquidity changes. This combination reduces the risk of acting on noisy data while ensuring you don't miss short-term market shifts.
Choose the Next Step in Your Crypto ETF Strategy
Turning on-chain data into a decision requires matching your capital allocation to specific flow signals. Spot Bitcoin and Ethereum ETFs now operate as the primary liquidity conduits for institutional and retail capital. When on-chain metrics show accumulation, the next move is to confirm whether flows are driven by long-term holders or short-term traders.
Use the following framework to interpret current market conditions and select your entry point.
Monitor daily net inflows for major spot funds. Sustained positive inflows over five consecutive trading days typically signal institutional conviction rather than speculative noise. If inflows are flat or negative, wait for a reversal before committing new capital.
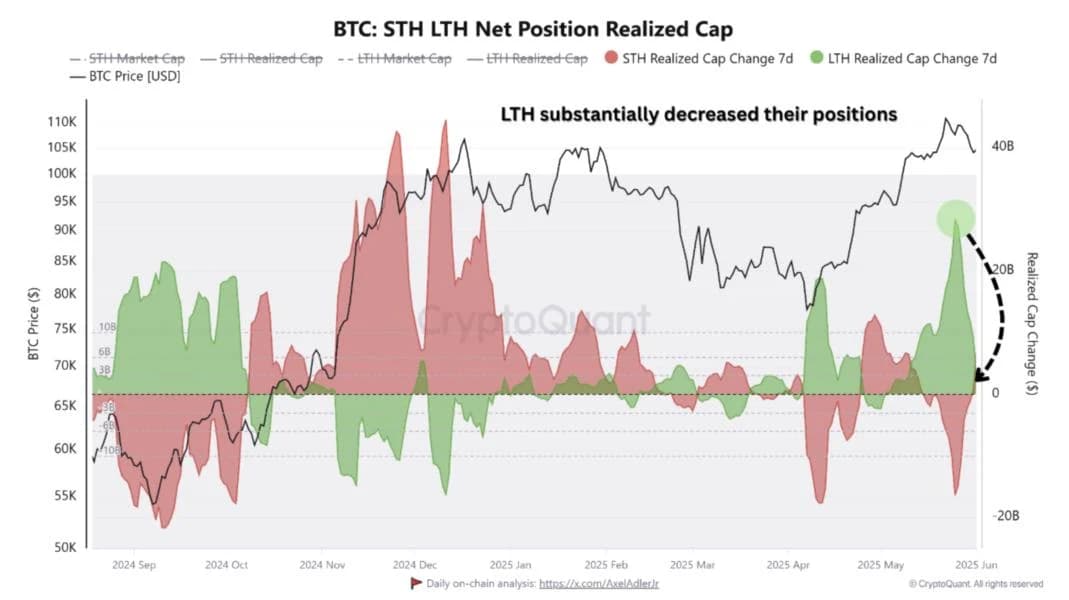
Analyze the on-chain supply held by wallets active for over six months. Rising long-term holder supply indicates that investors are moving coins to cold storage, reducing sell-side pressure. A decline in this supply suggests distribution and potential price weakness.
Track the total balance of Bitcoin and Ethereum on centralized exchanges. Declining exchange reserves imply that assets are being moved to private wallets or ETF custody, tightening available supply. Rising reserves often precede sell-offs as assets become liquid for trading.

Evaluate whether spot ETFs are trading at a premium or discount to their Net Asset Value (NAV). Consistent premiums indicate strong demand exceeding supply, while discounts suggest oversupply or investor hesitation. This metric is critical for timing entry points in efficient markets.
Avoid Weak ETF Options
Spot Bitcoin and Ethereum ETFs dominate the market, but not all funds offer equal value. Tracking smart money flows requires ignoring low-volume options that create liquidity traps. A single large trade can distort price signals in thinly traded vehicles, leading to false conclusions about institutional sentiment.
Liquidity and Volume Traps
Many newer or niche spot ETFs suffer from low daily trading volumes. While their expense ratios might appear competitive, the bid-ask spreads are often wide. This makes entering and exiting positions costly. Smart money flows are best tracked through high-liquidity leaders where price discovery is efficient.
Expense Ratio Reality
Some providers advertise zero-fee periods to attract early assets. However, these are temporary marketing tactics. Once the promotion ends, fees revert to higher levels. Always check the trailing twelve-month expense ratio, not just the initial promotional rate. Long-term holding costs compound quickly, eroding returns.
Custody and Security
The underlying custody solution matters more than the fund name. Ensure the ETF uses a regulated custodian with a transparent security history. Avoid funds that obscure their custody arrangements. The 2026 market has seen several regulatory actions against funds with opaque storage practices.
Decision Guide
Prioritize funds with the highest average daily volume and lowest persistent expense ratios. Use the comparison table below to filter out weak options based on concrete metrics rather than marketing claims.
| Fund Type | Liquidity | Risk Level |
|---|---|---|
| Large Cap ETFs | High | Low |
| Niche/Low Volume | Low | High |
| Promotional Fee Funds | Variable | Medium |
Crypto etf on-chain data 2026: what to check next
On-chain tracking for spot Bitcoin and Ethereum ETFs has shifted from simple inflow monitoring to analyzing distribution patterns and fee drag. In early 2026, markets saw strong risk-on action with BTC surging 7.7% to $93,816 and ETH gaining 10.0% to $3,223, driven by returning ETF flows [[src-2]]. However, demand has shown volatility, with recent data suggesting a stabilization after earlier weakening in spot Bitcoin ETF flows [[src-3]].
How do I track real-time spot Bitcoin ETF flows?
Most investors rely on daily flow data published by fund issuers like BlackRock, Fidelity, and Grayscale. On-chain analytics platforms like Amberdata and CoinMarketCap aggregate this data to show net inflows and outflows [[src-1]][[src-2]]. For a broader view of the blockchain ETF landscape, ETF Database provides comprehensive holdings data for all U.S.-listed blockchain ETFs [[src-4]].
What do on-chain metrics reveal about smart money moves?
Smart money often accumulates during periods of negative sentiment or low inflows, while distributing during rallies. In 2026, the major issuers—BlackRock, Fidelity, Bitwise, Grayscale, and Morgan Stanley—have become the primary conduits for institutional capital [[src-5]]. Tracking their specific on-chain wallet activity can signal whether large players are positioning for a long-term hold or preparing for short-term exits.
Why do spot ETF prices sometimes diverge from Bitcoin’s spot price?
Divergence often stems from fee structures and liquidity mismatches. Spot ETFs charge expense ratios that gradually erode value relative to the underlying asset. Additionally, if redemption queues build up or trading volume is thin, the ETF’s market price can trade at a premium or discount to its net asset value (NAV). This is particularly common during high-volatility events when arbitrageurs struggle to keep prices aligned.
Is on-chain data reliable for predicting short-term ETF performance?
On-chain data is better suited for identifying medium-term trends than predicting daily price action. While it reveals where capital is accumulating, it doesn’t account for macroeconomic shocks or regulatory news. Use on-chain metrics to confirm the strength of a trend rather than as a standalone timing signal. Combining flow data with technical analysis provides a more robust framework for decision-making.

No comments yet. Be the first to share your thoughts!