
What crypto ETF on-chain data actually shows
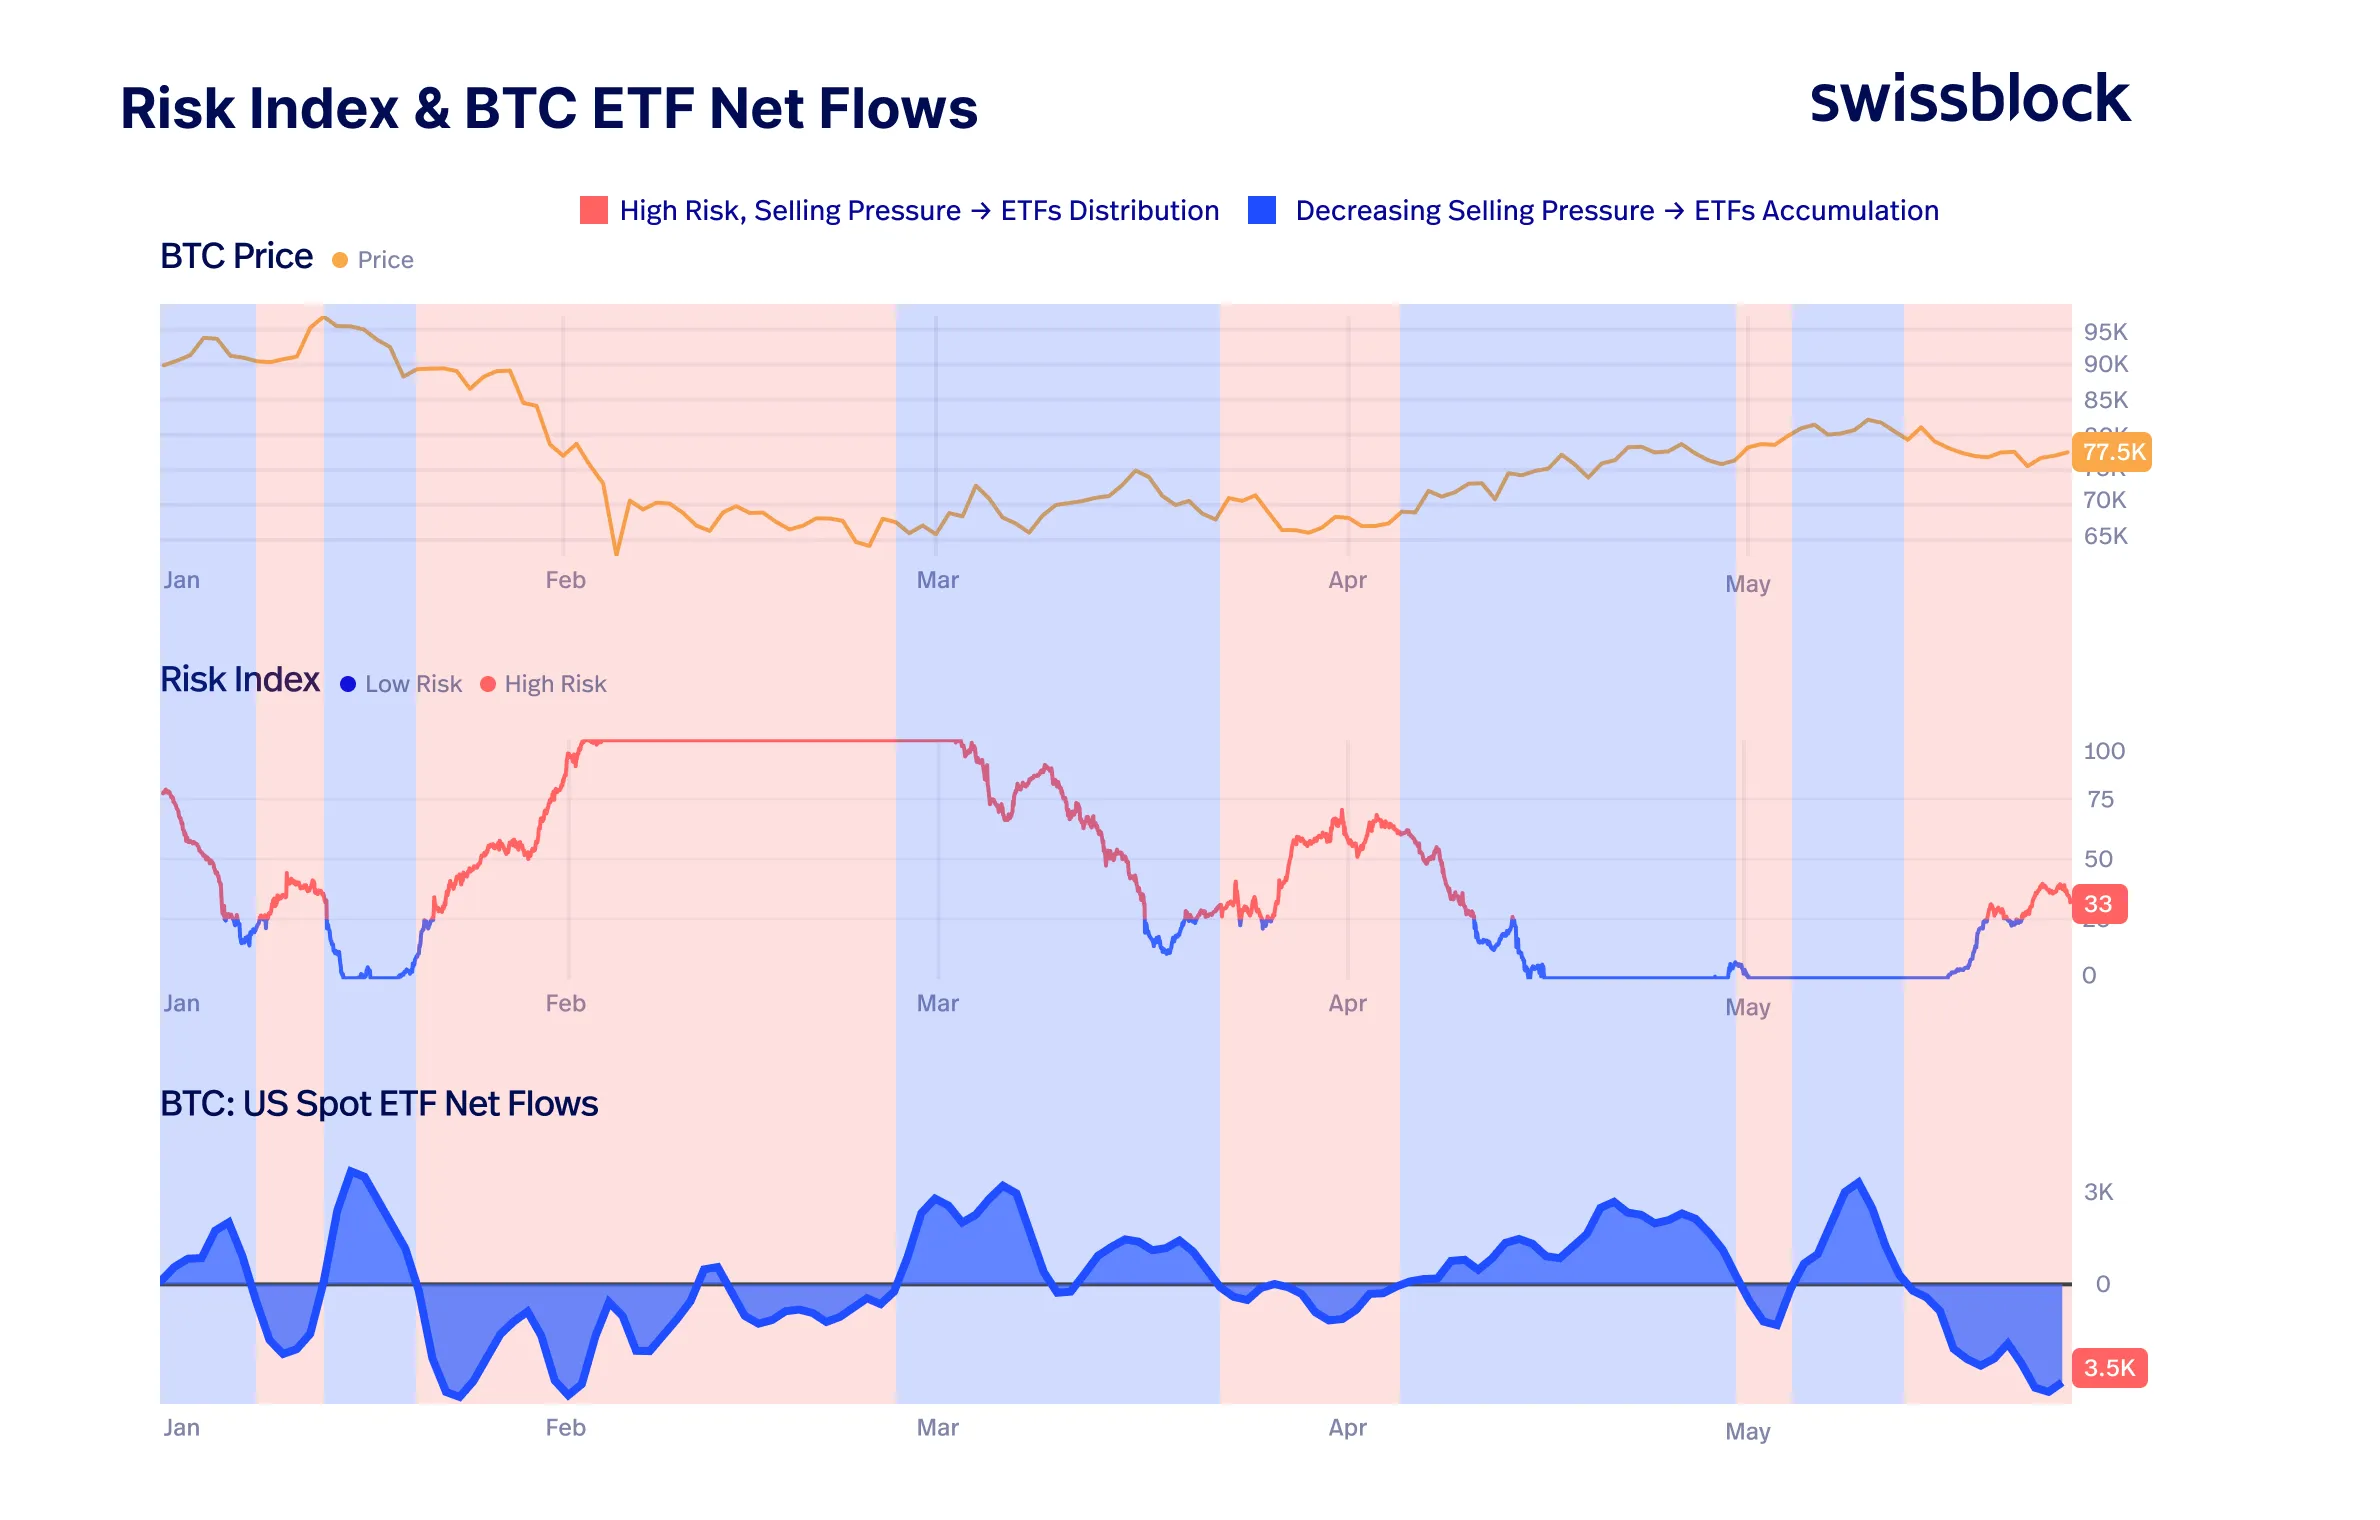
The central tension for institutional crypto investing is the gap between exchange balance and actual custody. When you buy a spot Bitcoin ETF, your shares are recorded on a traditional ledger. The underlying Bitcoin, however, moves on a blockchain. Tracking these flows in real-time requires looking at two different layers of data: the fund’s daily creation/redemption reports and the actual on-chain movements of the custodian wallets.
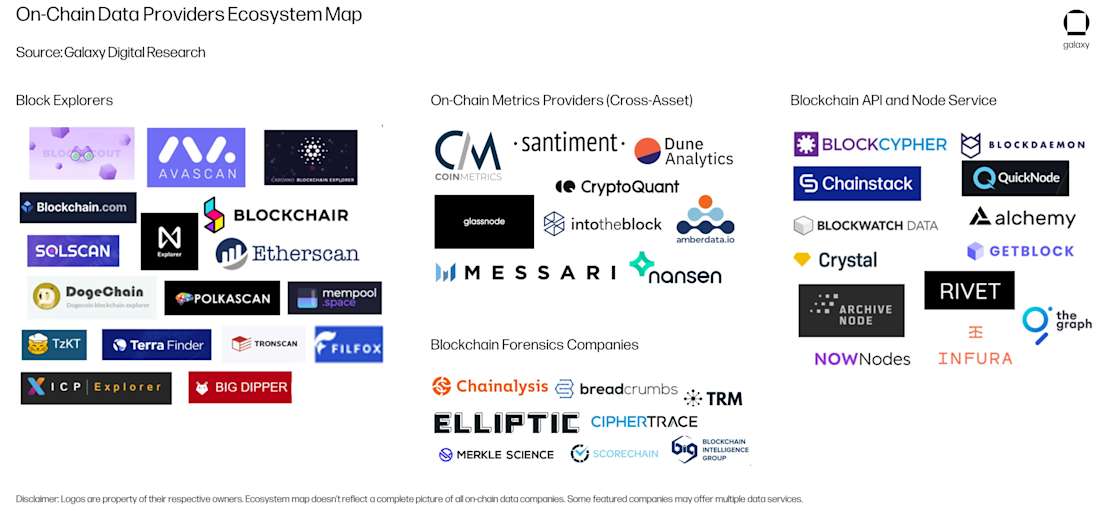
Most retail dashboards show price and simple volume. Institutional-grade on-chain analytics, such as those from Coin Metrics or Glassnode, track the specific addresses held by custodians like BitGo or Coinbase Custody. By monitoring these wallets, you can see if new Bitcoin is entering ETF custody (inflows) or leaving for exchanges (outflows). This distinction is critical because large outflows to exchanges often signal potential selling pressure, while accumulation in cold storage suggests long-term holding.
The challenge is that this data is not always perfectly synchronized. ETF creation units are settled daily, but on-chain transactions happen continuously. There is also a lag between when an ETF provider files its holdings with the SEC and when those holdings appear on-chain. For precise tracking, you need tools that aggregate these sources. Services like Talos or Coin Metrics provide specialized dashboards that correlate ETF flow data with on-chain wallet activity, giving a clearer picture of institutional intent than price charts alone.
For most investors, a combination of official ETF flow reports from providers like BlackRock (iShares) or Fidelity, and on-chain wallet tracking, provides the most complete view. You do not need to monitor every single transaction, but watching the net change in custodian wallets over a weekly or monthly period reveals the true direction of institutional capital.
Crypto ETF on-chain data choices that change the plan
Tracking institutional flows requires balancing speed, accuracy, and cost. On-chain data reveals the raw settlement layer activity, but interpreting it for ETF performance involves specific tradeoffs that affect your analysis.
Data latency vs. real-time visibility
Spot Bitcoin ETFs settle on traditional financial rails, but the underlying assets move on public blockchains. This creates a lag. On-chain trackers like Coin Metrics provide near-instant visibility into wallet movements, while official custodian reports may take 24-48 hours to reflect in public filings. If you are trading short-term volatility, real-time on-chain data offers a signal edge. For long-term holding, the delay is irrelevant.
Granularity vs. aggregation
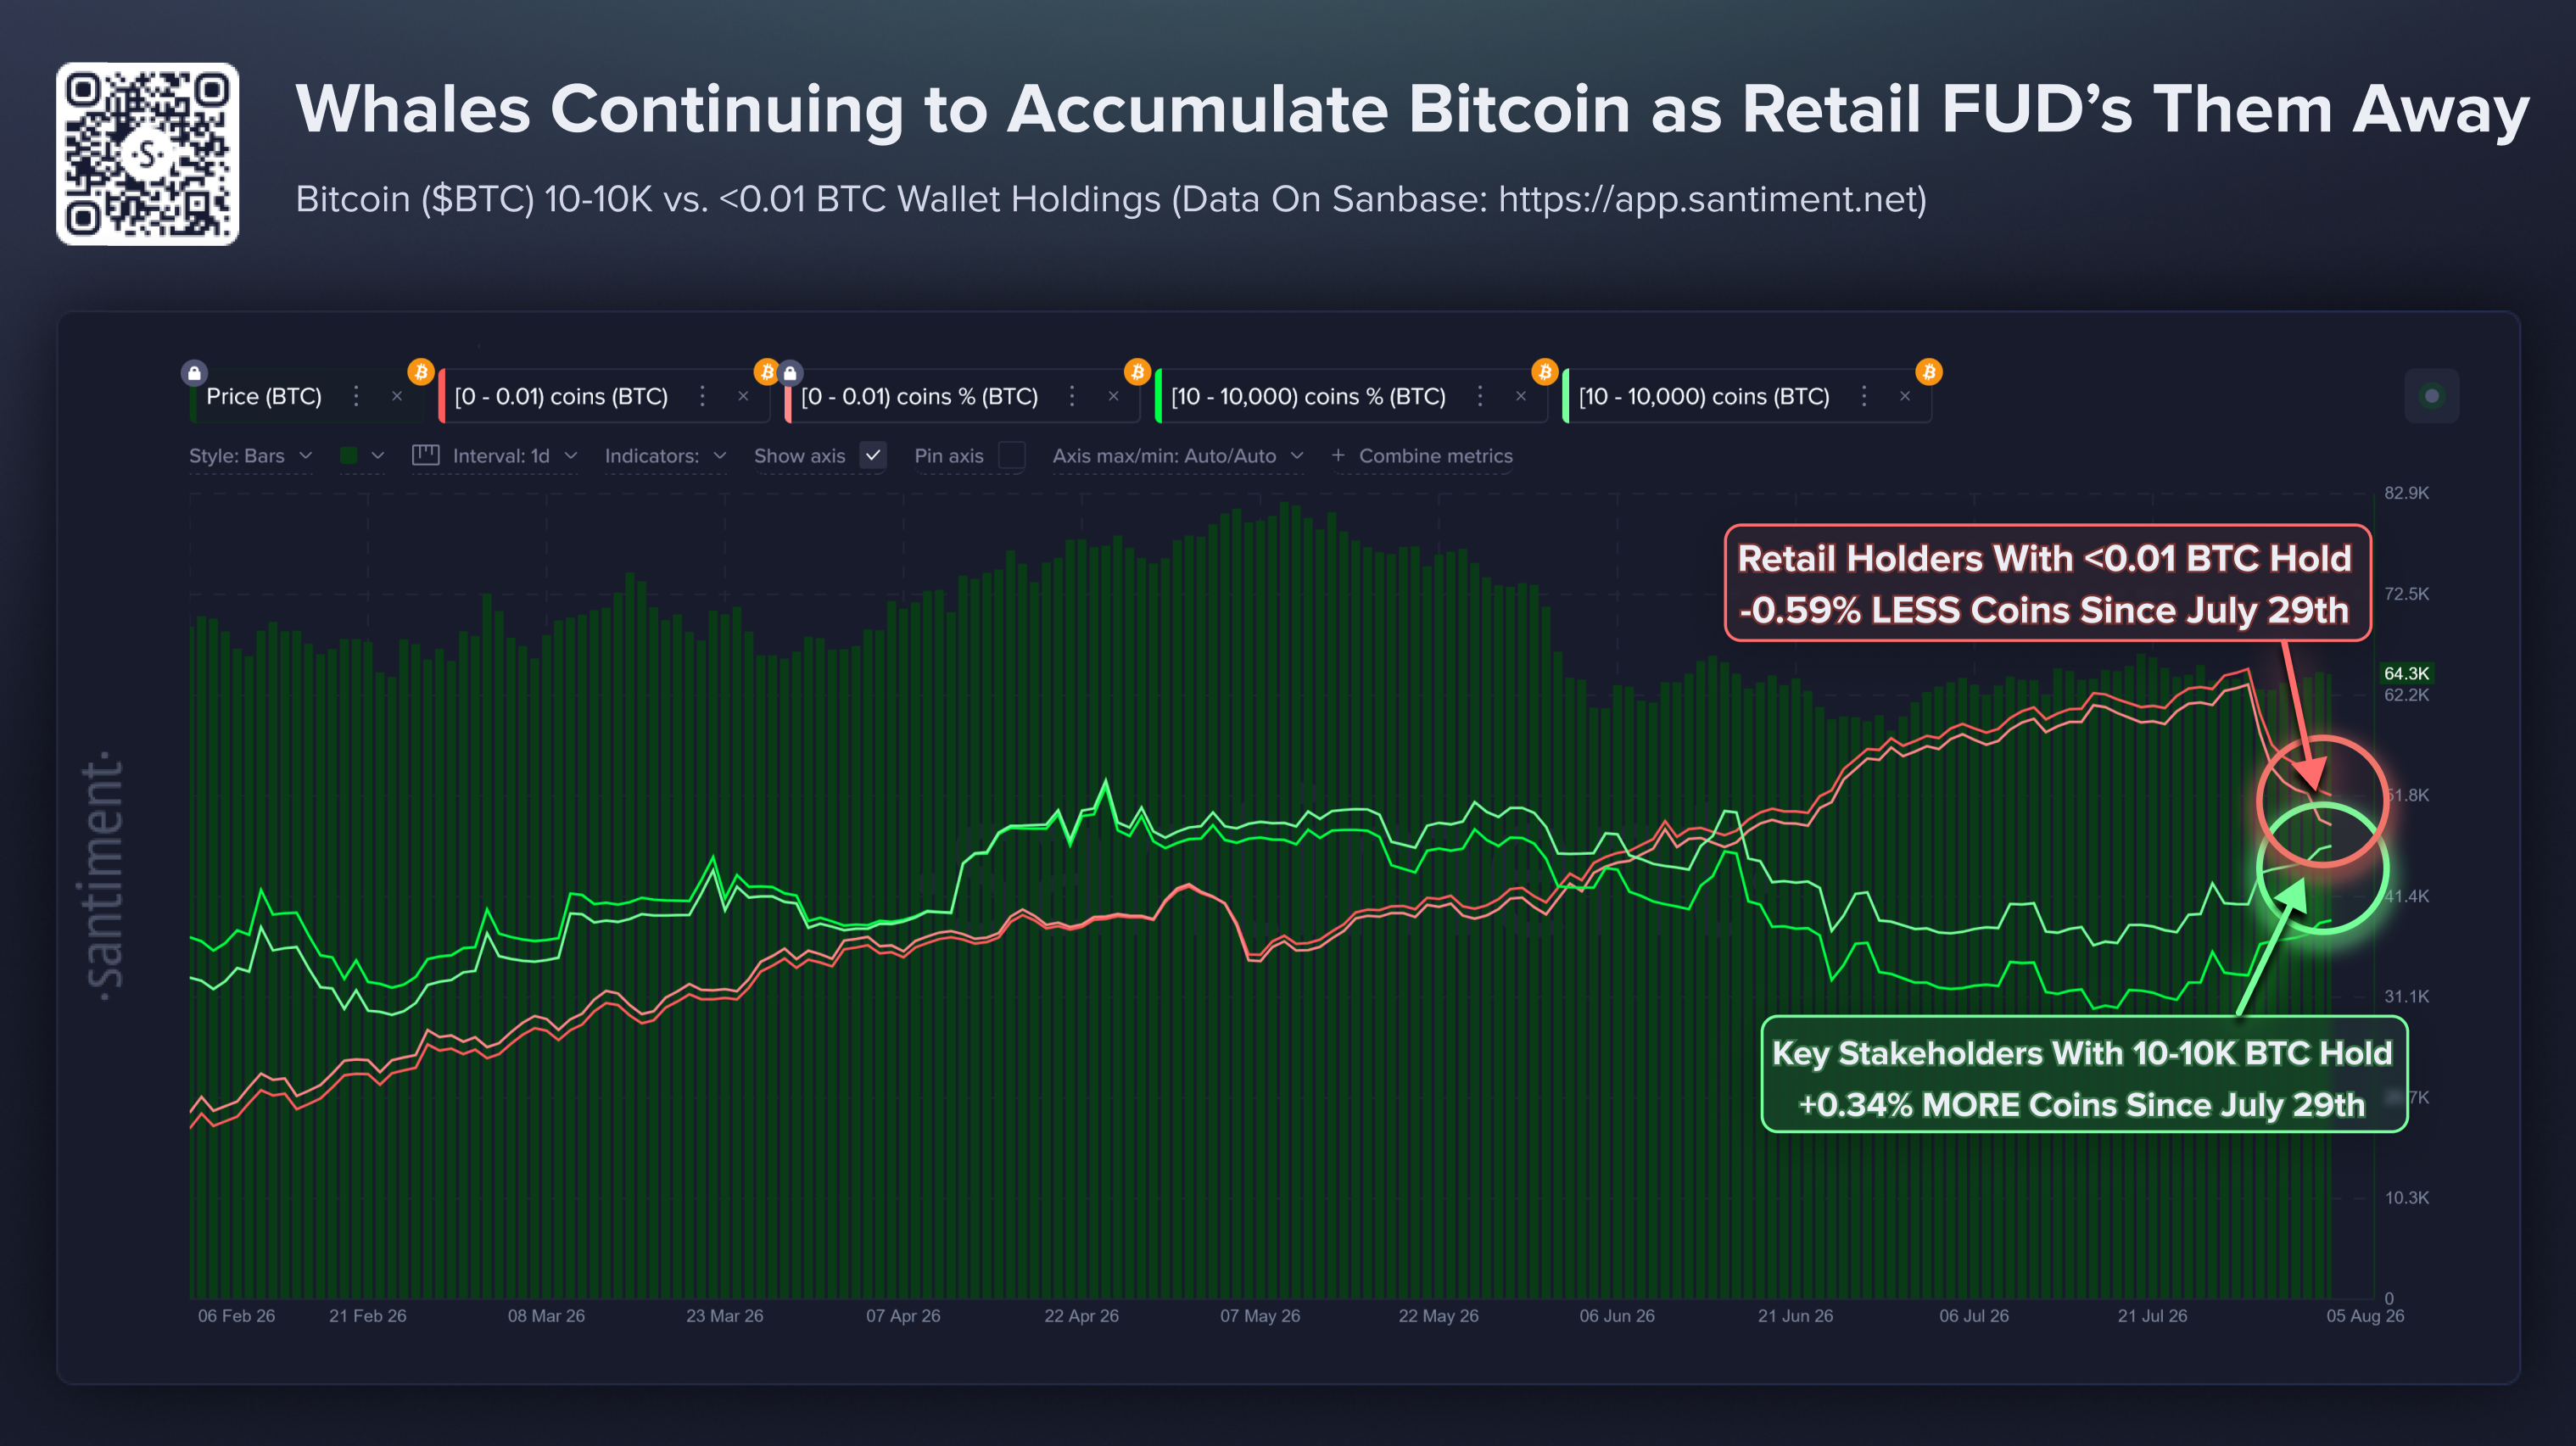
Not all on-chain data is equal. Some providers offer granular wallet tracking, allowing you to see exactly which custodian addresses are receiving or sending funds. This is useful for identifying specific institutional players. Others offer aggregated metrics, showing total inflows and outflows without identifying the source. Aggregated data is easier to digest but hides the "whale" activity that often drives price swings.
Cost vs. accessibility
High-fidelity on-chain data is expensive. Institutional-grade platforms charge significant fees for real-time alerts and historical depth. Retail investors often rely on free or low-cost aggregators like CoinMarketCap or Etherscan. While these are sufficient for general trends, they lack the precision needed to track specific ETF flow dynamics accurately.
The Tradeoff Matrix
The table below compares the primary tradeoffs across common data sources.
| Data Source | Latency | Granularity | Cost |
|---|---|---|---|
| Coin Metrics | Near-real-time | High (Wallet-level) | High |
| Etherscan/Blockchain Explorers | Real-time | Medium (Public only) | Free |
| Custodian Reports | 24-48 hours | Low (Aggregate) | Free (Public) |
| CoinMarketCap ETF Tracker | Daily | Low (Aggregate) | Free |
Why it matters for your strategy
Choosing the right data source depends on your trading horizon. Day traders need the speed of on-chain trackers. Long-term investors can rely on daily aggregates. Mixing these sources without understanding their limitations leads to false signals.
Choose the next step
Crypto ETF on-chain analytics works best as a clear sequence: define the constraint, compare the realistic options, test the tradeoff, and choose the path with the fewest hidden costs. That order keeps the advice usable instead of decorative. After each step, pause long enough to check whether the recommendation still fits the reader's actual situation. If it depends on perfect timing, unusual access, or a best-case budget, include a simpler fallback.
Spotting misleading on-chain claims
Real-time on-chain analytics for crypto ETFs have become a primary tool for tracking institutional flows, yet the data often obscures more than it reveals. Many platforms report aggregate inflows without distinguishing between primary market creations by authorized participants and secondary market trades by retail investors. This distinction is critical: primary inflows reflect new capital entering the fund, while secondary trades merely shift ownership among existing holders.
A common mistake is interpreting a spike in "net inflows" as bullish conviction. Without verifying the source of these flows through primary market data, you may mistake routine rebalancing for strong institutional demand. Additionally, some analytics tools delay the reporting of on-chain movements, rendering "real-time" claims inaccurate by the time they appear in your dashboard. Always cross-reference flow data with the ETF issuer's official daily holdings reports to confirm the validity of on-chain signals.
Crypto ETF on-chain data: what to check next
Investors tracking institutional flows often face specific hurdles when interpreting real-time on-chain metrics. Below are answers to the most common practical questions regarding ETF availability, data verification, and market selection.

No comments yet. Be the first to share your thoughts!