
The crypto etf on-chain data limits to account for
Tracking institutional flows in spot Bitcoin ETFs requires looking past the daily net inflow numbers. While headlines focus on whether money is entering or leaving, the real story lies in the on-chain activity of the custodians. This data reveals how institutions are actually managing their exposure, often before it impacts the public market price.
The primary constraint is that on-chain data is not a direct feed of ETF performance. It tracks the underlying Bitcoin held by custodians like Coinbase and BitGo. You must correlate these wallet movements with exchange deposits and withdrawals to understand if accumulation is genuine or merely internal reshuffling. Without this context, on-chain metrics can be misleading.
To navigate this, you need reliable data aggregators that bridge the gap between traditional finance filings and blockchain analytics. Platforms like The Block and CoinMarketCap provide curated dashboards that simplify this complexity. They offer real-time views of AUM, trading volumes, and on-chain holdings for major funds like BlackRock’s IBIT and Fidelity’s FBTC. Using these tools helps you separate signal from noise.
Crypto etf on-chain data choices that change the plan
Tracking institutional flows requires balancing granularity against accessibility. The block data from The Block and Coin Metrics provides precise visibility into daily net flows and aggregate AUM, which is essential for understanding short-term momentum. However, this level of detail often comes with a steeper learning curve or restricted access for retail users.
Conversely, broader aggregators like CoinMarketCap or MacroMicro offer simplified views of total holdings and ETF dominance. These platforms are excellent for quick sentiment checks but may lag in real-time precision or lack the granular wallet-level insights needed for deep institutional analysis. Choosing the right tool depends on whether you prioritize immediate flow data or long-term supply trends.
| Data Source | Granularity | Access Level | Best For |
|---|---|---|---|
| The Block | High (Daily Flows) | Freemium/Paid | Real-time flow tracking |
| Coin Metrics | High (Wallet-Level) | Institutional | Deep on-chain analysis |
| CoinMarketCap | Medium (Aggregate) | Free | Quick sentiment checks |
| MacroMicro | Medium (Trends) | Free | Long-term supply trends |
Build an on-chain ETF monitoring framework
Tracking crypto ETF flows requires moving beyond static daily summaries. You need a system that connects on-chain wallet movements to exchange inflows and outflows. This framework turns raw data into a actionable view of institutional behavior.
1. Track major ETF wallet addresses
Identify the primary custody addresses for top funds like BlackRock (IBIT) and Fidelity (FBTC). Use explorers to monitor these specific wallets for large transfers. A significant move from a custody wallet to an exchange often signals potential selling pressure, while transfers to cold storage suggest accumulation. This direct line of sight is more reliable than waiting for end-of-day reports.
2. Monitor exchange net flows
Exchange net flows act as a liquidity gauge. Positive net inflows mean assets are arriving at exchanges, often prelude to sales. Negative net outflows indicate assets are leaving exchanges, typically for long-term holding. Correlate these flows with ETF issuance data. If ETF issuers are creating shares while exchange inflows rise, institutional distribution is accelerating.
3. Analyze stablecoin liquidity pools
Watch USDT and USDC supply changes on major chains. Sustained growth in stablecoin liquidity often precedes ETF buying, as institutions park capital before deploying it. Conversely, rapid stablecoin burns or transfers to lending protocols can signal risk-off behavior. This metric provides an early warning system for capital rotation into or out of crypto ETFs.
4. Set up real-time alerts
Manual monitoring is insufficient for institutional-grade analysis. Configure alerts for specific wallet movements, exchange flow thresholds, and stablecoin supply shifts. Tools like The Block or CoinMarketCap offer dashboards, but custom alerts ensure you react to anomalies immediately. Prioritize alerts for high-volume addresses to filter noise.
5. Validate with on-chain volume
Cross-reference your flow data with on-chain trading volume. High ETF inflows without corresponding on-chain volume increases may indicate passive holding rather than active trading. Conversely, rising volume with stagnant flows suggests speculative activity. This validation step prevents misinterpreting market sentiment based on incomplete data.
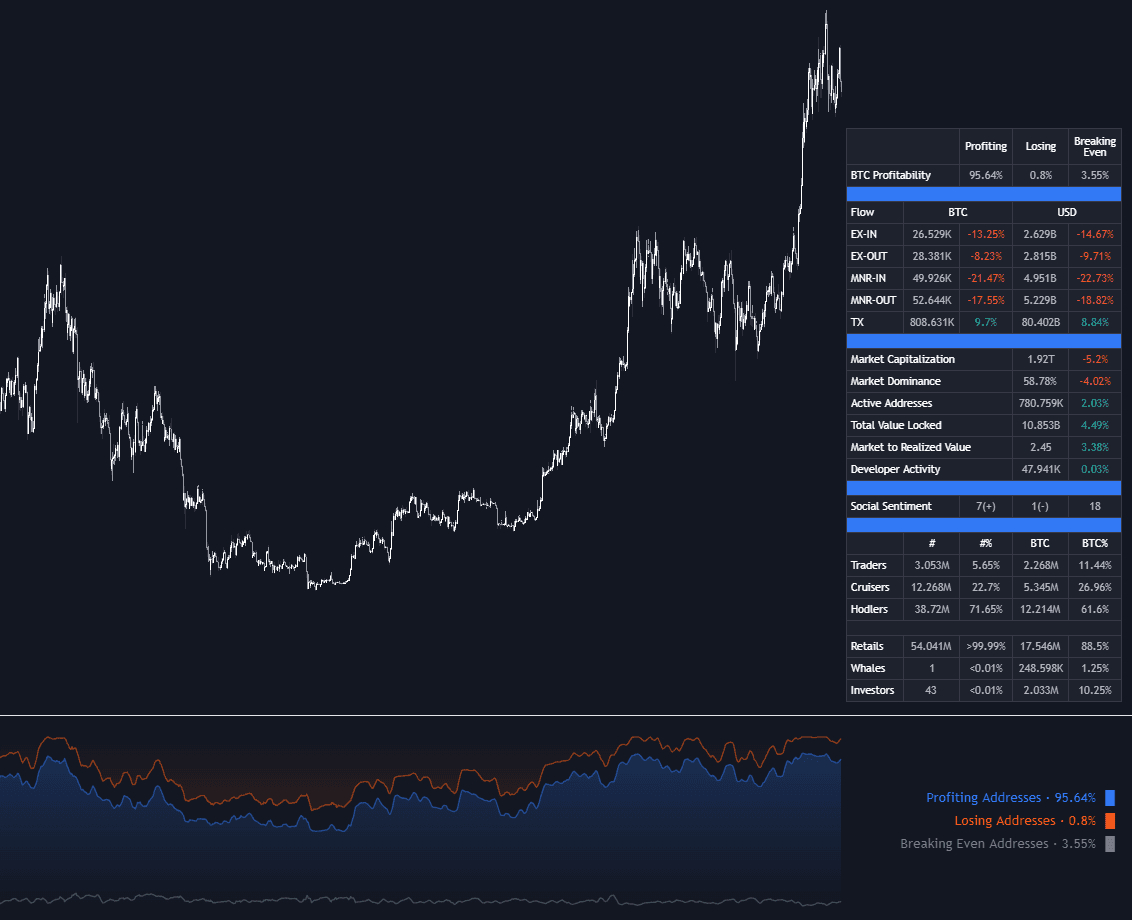
Locate the primary cold storage addresses for major ETF issuers. Use block explorers to verify these addresses are linked to known institutional custodians like Coinbase Custody or Fidelity Digital Assets. This establishes your baseline for tracking institutional accumulation.
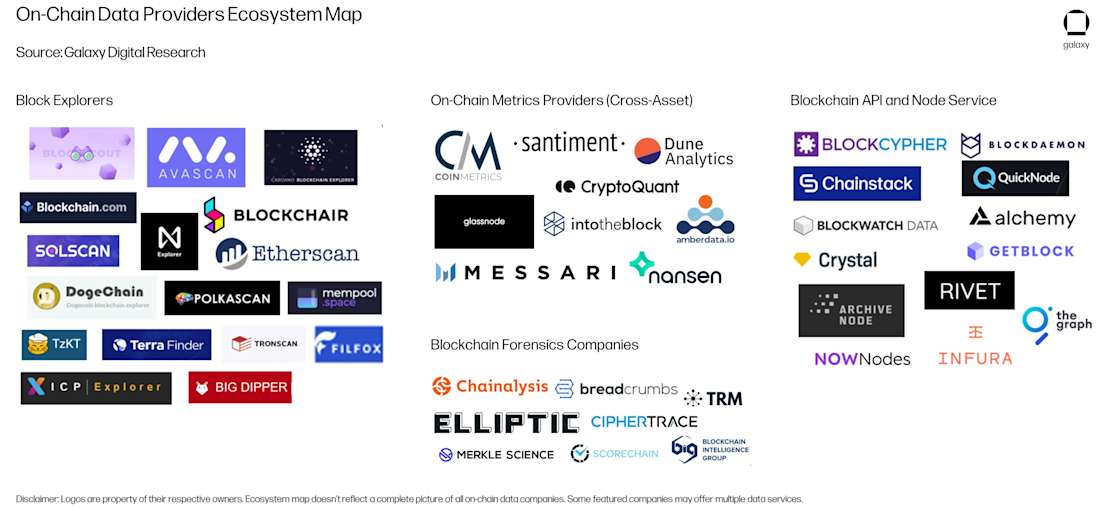
Track net flows into and out of major exchanges. A surge in exchange inflows from ETF custody wallets often precedes selling pressure. Use real-time dashboards to visualize these movements, focusing on the top 10 ETFs by assets under management for the most significant market impact.

Analyze USDT and USDC supply changes. Growth in stablecoin liquidity often precedes ETF buying, while rapid burns may signal risk-off behavior. This metric helps distinguish between passive holding and active capital deployment by institutional investors.
| Metric | Signal | Action |
|---|---|---|
| Custody to Exchange | Potential Selling | Watch for price dips |
| Exchange to Custody | Accumulation | Consider entry points |
| Stablecoin Supply Growth | Capital Deployment | Monitor ETF inflows |
| Stablecoin Supply Burn | Risk Off | Reduce exposure |
Watchouts for misleading crypto ETF claims
Real-time on-chain data is the only way to separate actual institutional demand from marketing noise. Many platforms report flows that look healthy but hide the source of the volume. If you are tracking Bitcoin spot ETFs for institutional flows, you need to verify the data against primary custodian records, not just aggregated third-party summaries.
Common data pitfalls
1. Confusing inflows with net demand Daily inflow numbers often include internal restructuring or fee accruals that do not reflect new money entering the market. A positive flow day might still result in net selling if existing holders are liquidating. Always check the net change in total AUM (Assets Under Management) alongside daily flow figures to see the true direction of capital.
2. Ignoring the "dark pool" of GBTC Grayscale’s GBTC has historically skewed aggregate data due to its massive redemption window. Even post-conversion, its unique fee structure and investor base can distort the average daily volume metrics reported by general aggregators. When analyzing trends, isolate GBTC data to see the genuine behavior of other major players like BlackRock (IBIT) or Fidelity (FBTC).
3. Relying on stale snapshots Many free dashboards update once per day. By the time you see the number, the market has moved. Institutional traders use on-chain analytics that track wallet movements in near real-time. If your tool does not show live wallet activity for the ETF issuers, you are likely reacting to yesterday’s news.
Where to look
Use provider-backed charts to verify price action against volume. Do not trust static tables that lack a time-series context.
For deeper structural analysis, compare the ETFs directly. A comparison table helps identify which issuers are gaining genuine traction versus those merely maintaining status quo.
| Issuer | Ticker | Recent Trend |
|---|---|---|
| BlackRock | IBIT | Stable Growth |
| Fidelity | FBTC | Stable Growth |
| Grayscale | GBTC | Declining/Neutral |
Crypto etf on-chain data: what to check next
Tracking crypto ETF flows requires distinguishing between exchange volume and actual on-chain custody. Unlike traditional equity funds, spot Bitcoin ETFs hold assets in digital wallets managed by custodians like Coinbase or Fidelity. This structure creates a transparent ledger of supply that traditional market data cannot fully capture.
The primary challenge is accessing real-time data. Most retail platforms delay settlement information by 24-48 hours. Institutional-grade on-chain analytics, such as those from Coin Metrics or Amberdata, provide near-instant visibility into issuer purchases and redemptions. This precision helps traders identify accumulation phases before they appear on standard order books.
Another common concern is data fragmentation. ETF holdings are spread across multiple issuers, each with different reporting frequencies. Aggregators like The Block or MacroMicro combine these sources to show total ETF dominance. Without this consolidation, it is difficult to assess whether inflows are coming from a single large issuer or broad market participation.

No comments yet. Be the first to share your thoughts!