
Crypto ETF on-chain data limits to account for
Reading crypto ETF flows through the lens of on-chain data reveals a distinct signal-to-noise problem. Unlike direct spot purchases on a blockchain, ETF transactions occur within traditional custodial ledgers. This structural separation means that on-chain metrics, such as wallet accumulation or exchange inflows, only capture a fragment of the total institutional activity. To get a complete picture, analysts must reconcile off-chain settlement data with on-chain exchange movements.
The primary constraint is timing. ETF net flows are reported daily by fund providers, but the underlying crypto assets often settle on-chain with a delay. This lag creates a window where on-chain price action may reflect retail sentiment rather than the actual institutional positioning that will settle later. For example, a massive ETF inflow reported on Tuesday might not appear as a visible on-chain deposit until Thursday, leading to short-term volatility that doesn't reflect the true net demand.
The fragmentation across multiple ETF issuers complicates the data further. Each major issuer uses different custodians and settlement protocols. Aggregating this data requires mapping specific custodian wallets to known ETF providers, a process that is prone to error. Without this mapping, on-chain data might misinterpret a custodian's internal rebalancing as a net outflow from the ETF ecosystem. Accurate tracking requires persistent monitoring of known custodian addresses rather than relying on generic exchange flow metrics.
To navigate these constraints, focus on high-conviction on-chain signals that persist despite the settlement lag. Look for sustained accumulation in known ETF custodian wallets rather than single-day spikes. Combine this with daily ETF flow reports from official sources like CoinMarketCap or etftrends to triangulate the true institutional sentiment. This hybrid approach helps filter out the noise of retail trading and reveals the actual direction of institutional capital.
Crypto ETF on-chain data choices that change the plan
Evaluating crypto ETFs requires balancing real-time flow data against structural market mechanics. On-chain metrics offer an immediate pulse on institutional sentiment, but they can be misleading if interpreted in isolation. Understanding the tradeoffs between liquidity, tracking error, and fee structures is essential for accurate analysis.
Liquidity and Trading Volume
High trading volume ensures tight bid-ask spreads, reducing slippage for large institutional orders. While spot Bitcoin ETFs like those from BlackRock and Fidelity show deep liquidity, smaller altcoin ETFs often suffer from wider spreads. This gap can significantly impact net returns during volatile market conditions.
Tracking Error and Fund Structure
Spot ETFs generally track their underlying asset more closely than active or futures-based funds. Active strategies, such as the ARK 21Shares On-Chain Bitcoin Strategy ETF, may deviate from spot prices due to management fees and tactical adjustments. Investors must weigh the potential for alpha against the cost of higher tracking error.
Fee Drag on Long-Term Returns
Expense ratios directly erode long-term compound growth. Even small differences in fees can accumulate significantly over time. For example, a 0.25% fee difference on a $100,000 investment over ten years can result in thousands of dollars in lost returns. Always compare the total cost of ownership, including trading commissions, when selecting an ETF.
| Metric | Spot ETF | Active ETF | Futures ETF |
|---|---|---|---|
| Tracking Error | Low | Medium | High |
| Liquidity | High | Medium | Medium |
| Fee Structure | Lower | Higher | Medium |
| Complexity | Simple | Complex | Complex |
How to Choose Your Next Step
Institutional flows are stabilizing, but picking the right entry point requires looking past headline net inflows. Spot Bitcoin ETFs have seen demand flatten, signaling a shift from speculative frenzy to structural accumulation. This section provides a practical framework to navigate these on-chain signals and identify where capital is actually moving.
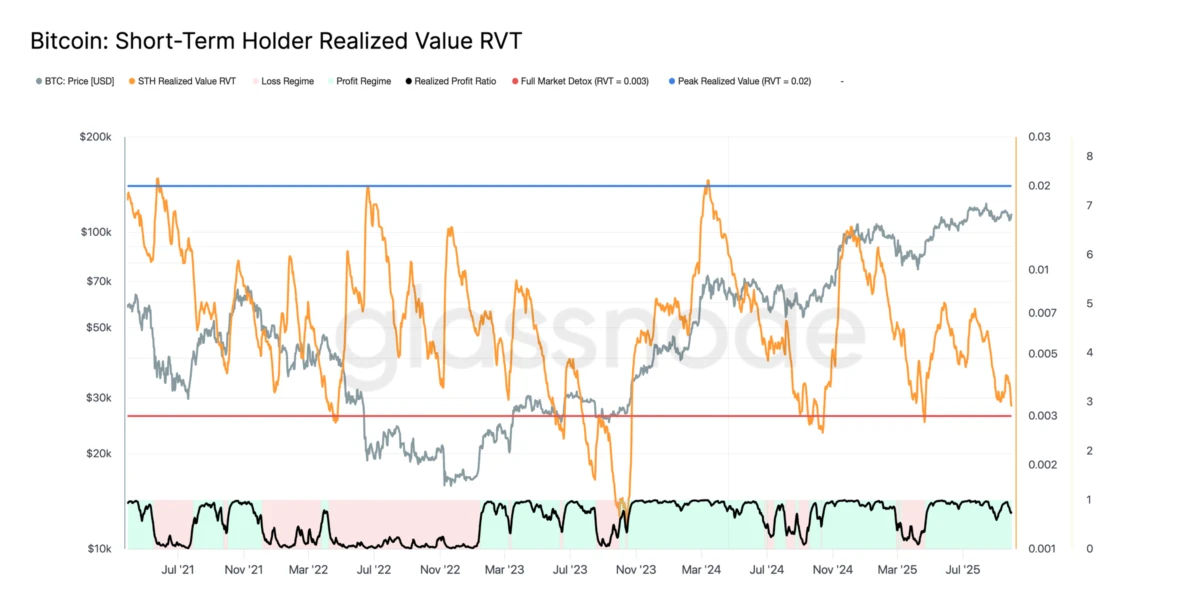
Start by checking daily net inflows on official trackers like CoinMarketCap or Farside Investors. Ignore single-day spikes; focus on the 7-day moving average to filter out noise. A consistent upward trend in the weekly average indicates genuine institutional conviction rather than short-term trading activity.
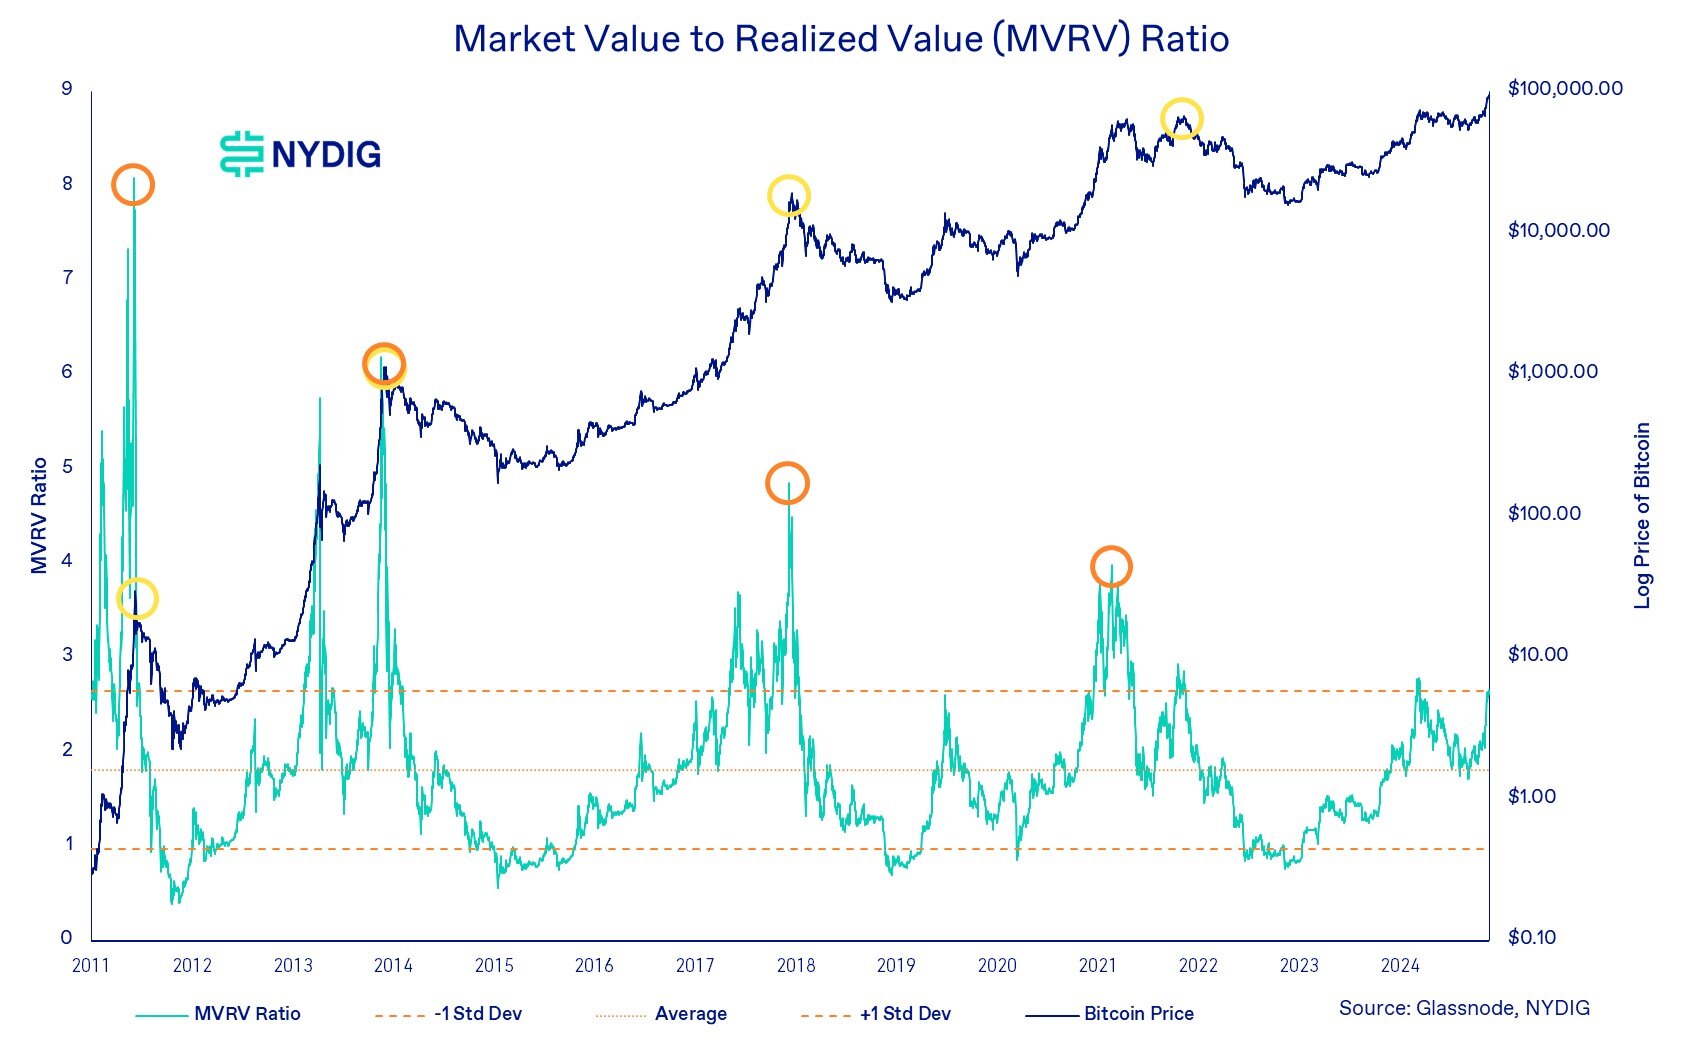
Look beyond the ETF price to the underlying asset’s on-chain metrics. High exchange reserves often signal selling pressure, while declining reserves suggest long-term holding. Correlate ETF inflows with these on-chain trends to confirm if institutional money is moving assets into cold storage for the long haul.
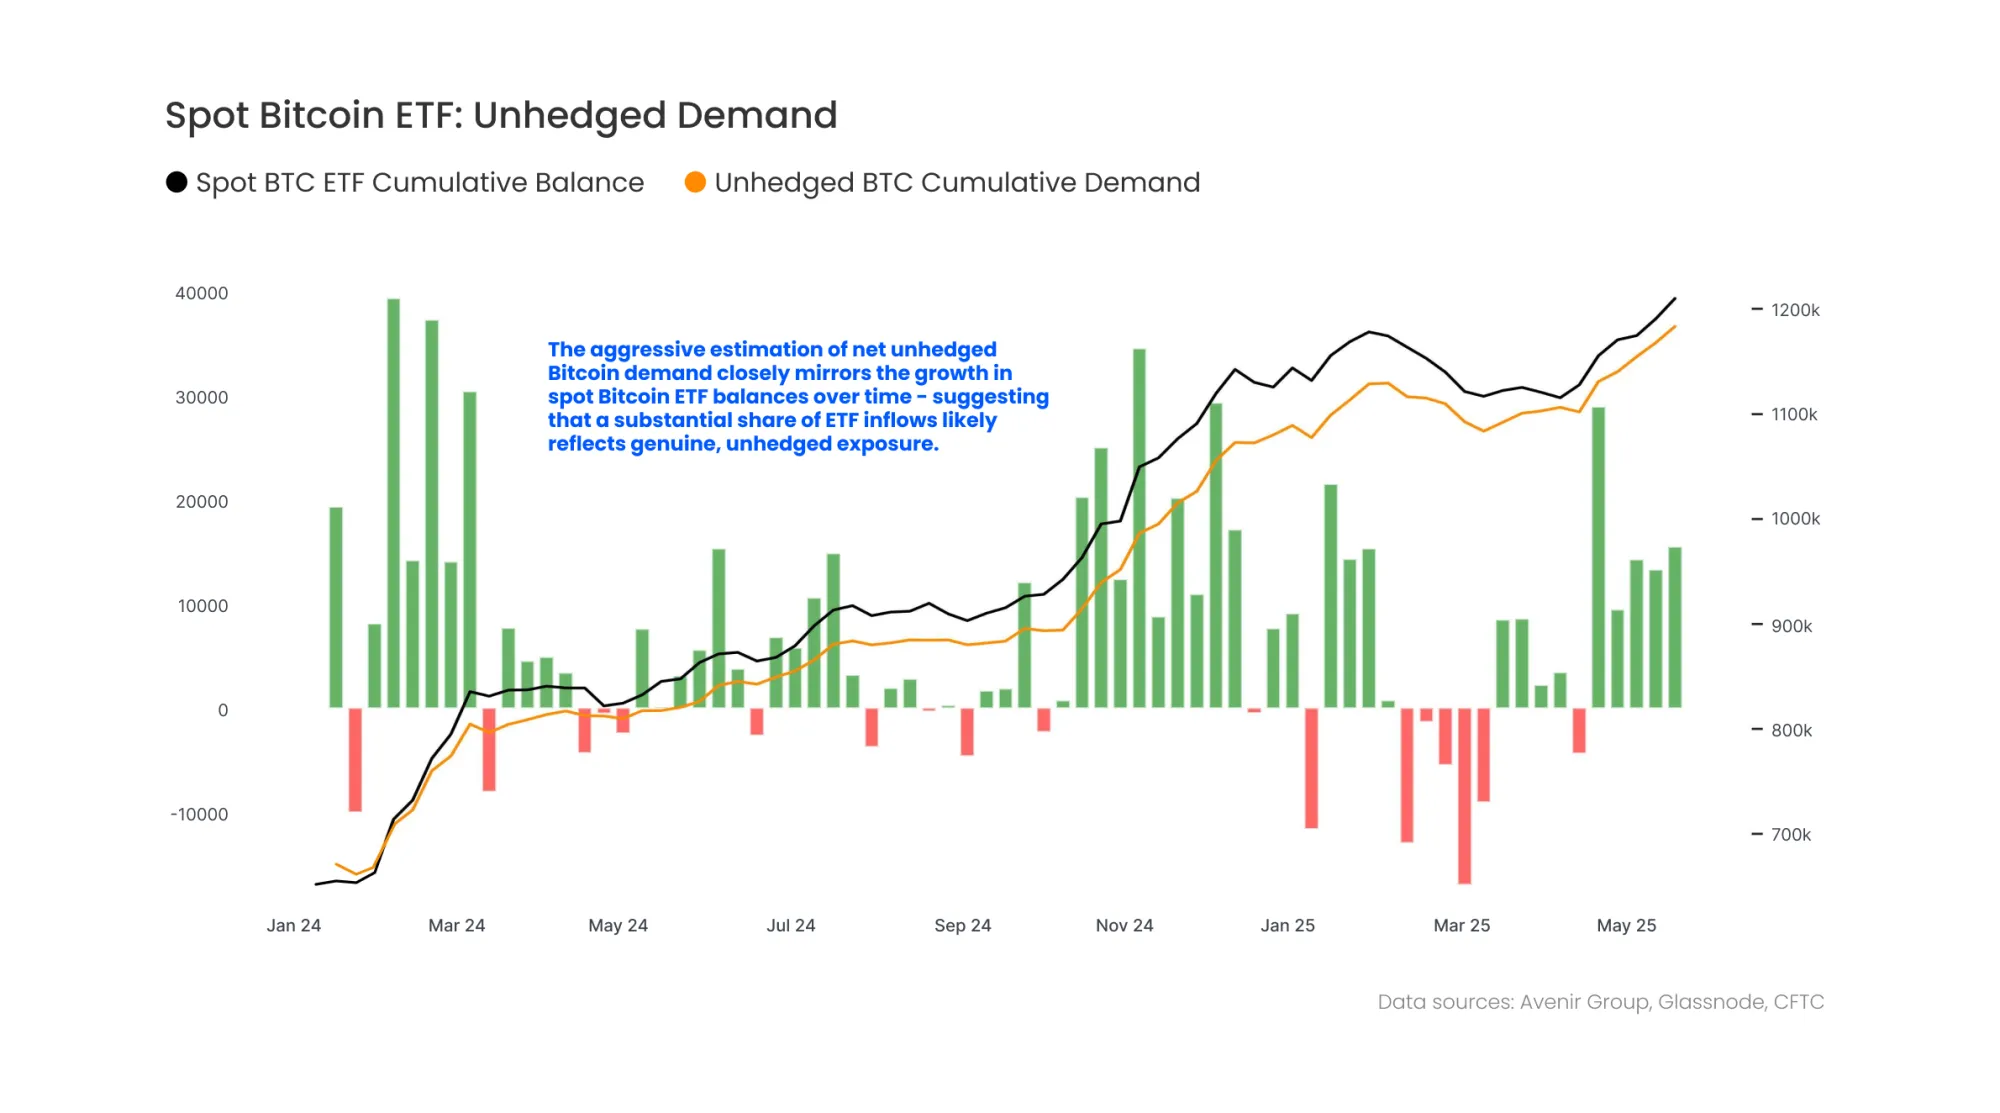
While Bitcoin remains the anchor, 2026 is seeing early interest in altcoin ETFs like Dogecoin and Chainlink. Monitor these emerging categories for early-stage flow data. Small inflows here can indicate significant future volatility and opportunity, but require higher risk tolerance than established Bitcoin vehicles.
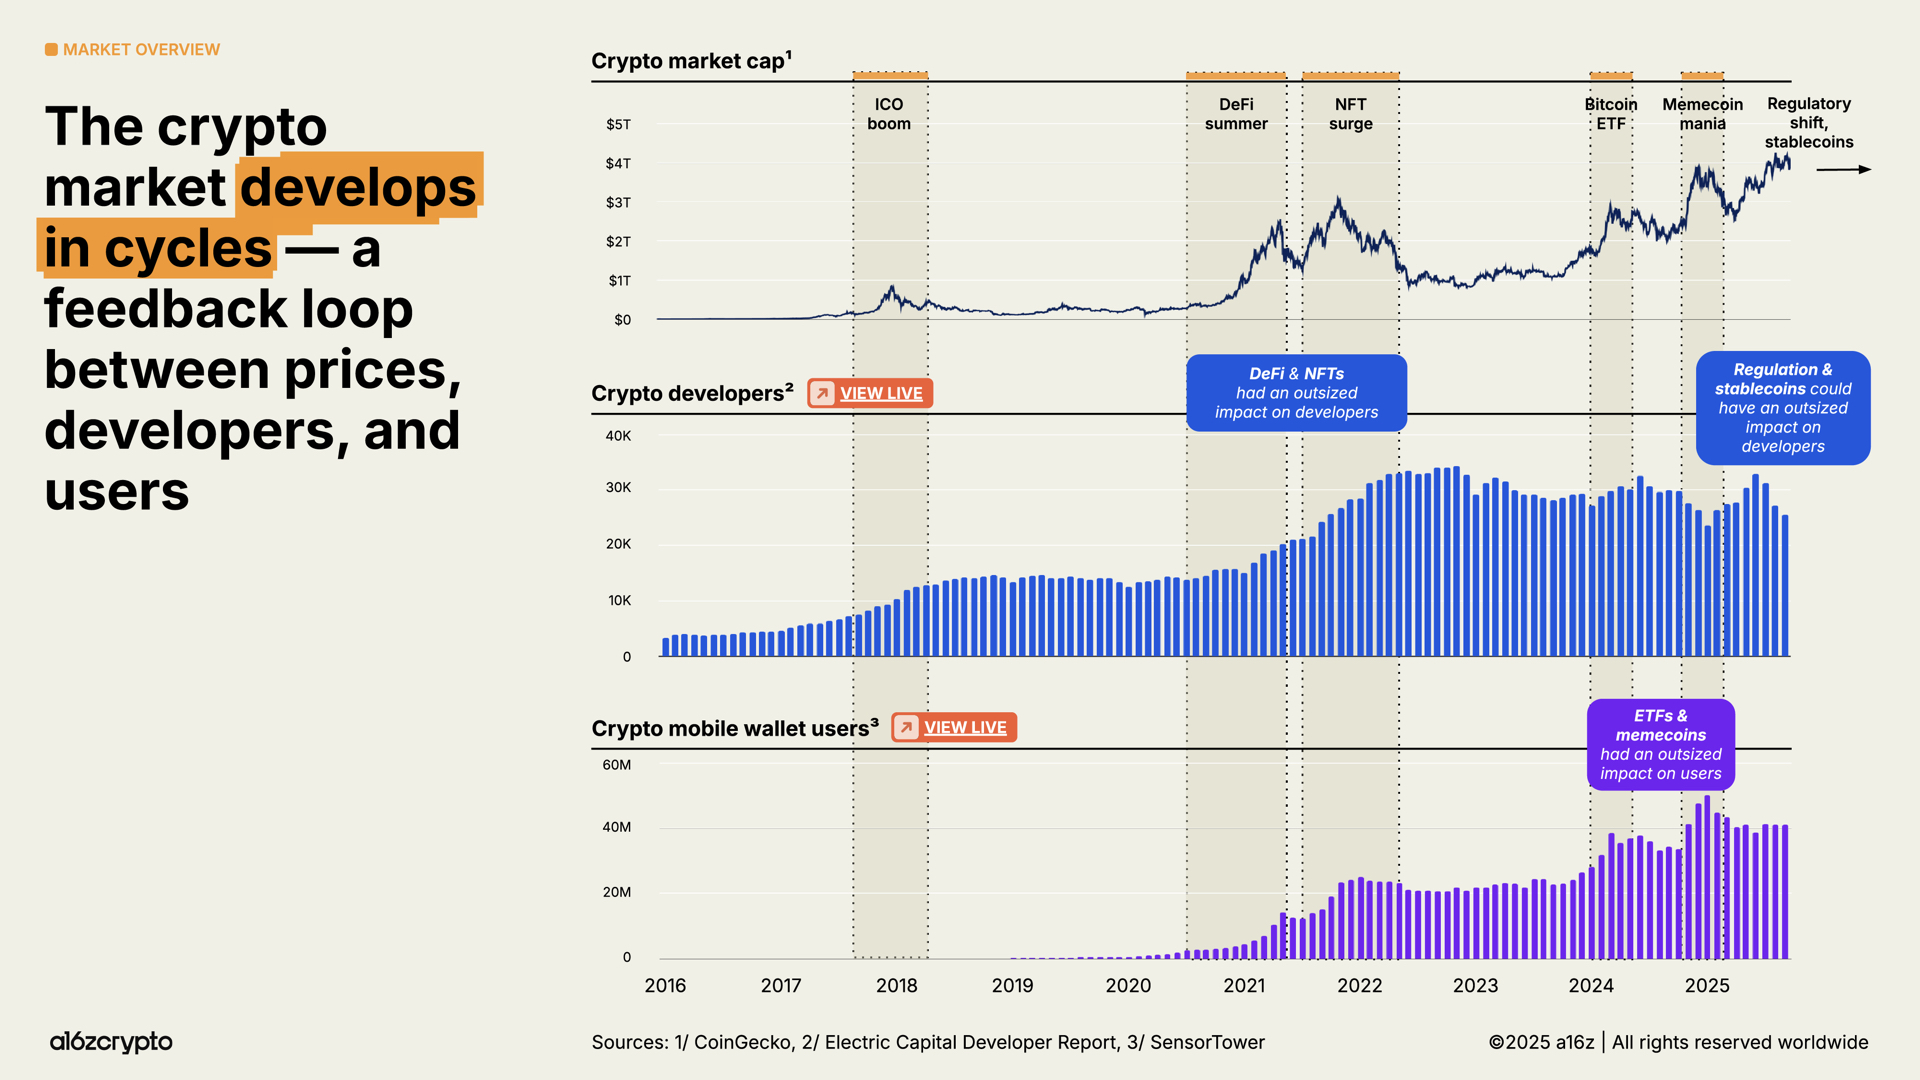
Combine flow data with broader market sentiment indicators. If ETF inflows are rising while retail fear is high, it often marks a strong buying opportunity. Conversely, rising inflows during peak retail euphoria may signal a near-term top. Use this divergence to time your entry relative to the broader market cycle.
Watch out for misleading ETF flow data
Spot Bitcoin ETF flows weakened earlier in 2026, but recent data suggests demand has started to stabilize (source: etftrends.com). When analyzing on-chain metrics, investors often mistake short-term volatility for long-term trends. It is crucial to look beyond daily headlines and examine the underlying institutional sentiment shifts.
Check the weak options carefully
Not all crypto ETFs are created equal. Some funds track niche assets like Dogecoin or Chainlink, which may offer higher volatility but less stability. Others focus on active on-chain strategies, such as the ARK 21Shares Active On-Chain Bitcoin Strategy ETF, which currently trades at $33.92 with a net asset value of $7,504.94 and a daily volume of $1.2M (source: coinmarketcap.com). These active funds may outperform passive trackers in certain market conditions, but they come with higher fees.
Avoid common mistakes in analysis
One common mistake is ignoring the broader market context. For example, while Bitcoin ETFs dominate the narrative, other cryptocurrencies like Solana or Cardano may have upcoming ETF approvals that could drive significant inflows. Investors should monitor these developments closely to avoid missing out on potential opportunities. Additionally, be wary of funds with low assets under management, as they may face closure if inflows remain weak.
Focus on real-time data
Real-time flow data is essential for making informed decisions. Use tools like TradingView to track price movements and technical indicators. For instance, the Bitcoin ETF forecast for 2026 suggests continued growth, but this depends on regulatory clarity and institutional adoption. Stay updated with official sources to ensure your analysis is based on accurate and timely information.

No comments yet. Be the first to share your thoughts!